Logs
AMI uses 3 different log file types. This page contains information on how to interpret and visualize the log files to troubleshoot performance issues in AMI.
Overview
AMI generates 3 different log files in each session:
-
AmiOne.log- The main log file with a human-readable output
- Primarily for identifying runtime exceptions (incorrectly configured plugins, panel element issues, etc)
- The level of logging detail can be configured in
local.properties
-
AmiOne.amilog- Machine-readable file with runtime statistics (memory use, process execution time, etc)
- Primarily for diagnosing performance issues like slowness
- The AMI log viewer visualizes this information in detail for easier diagnostics
-
AmiMessages.log- Tracks real-time messages being sent to and from AMI
- Primarily used for message replay
By default, these are stored in the amione/log directory of the AMI installation being run, but this location can be changed in local.properties:
AmiOne.log and AmiOne.amilog files are most commonly used to diagnose issues with their AMI sessions.
Note
We recommend using the AMI log viewer to interpret AmiOne.amilog files (see below), but users can read and interpret the file directly (see this section).
AMI Log Viewer
Note
We have updated our log viewer which is reflected in the screenshots below. The new layout is more performant and supports comparison of two log files. Both viewers are still available for use and download.
The log viewer is an AMI layout that takes AmiOne.amilog files and generates detailed charts of following areas in AMI:
- Messages
- Memory Details
- Threads
- Events
- Objects
- Web
- Timers
- Procedures
- Triggers
- WebBalancer
If you are experiencing performance issues, these graphs can quickly highlight and help diagnose problem areas. See this section to interpret each chart.
To use the log viewer, please follow the setup steps below.
Setup
-
Download the log viewer AMI layout (or copy the JSON) and the custom classes JAR.
-
Add the custom classes JAR file to the
amione/libdirectory of your AMI installation. -
Add the following properties to
local.propertiesto load the custom classes: -
Launch AMI and open the
logviewer.amifile via File -> Open -> (select the appropriate option based on the file location) or paste the layout JSON in the import window under File -> Import.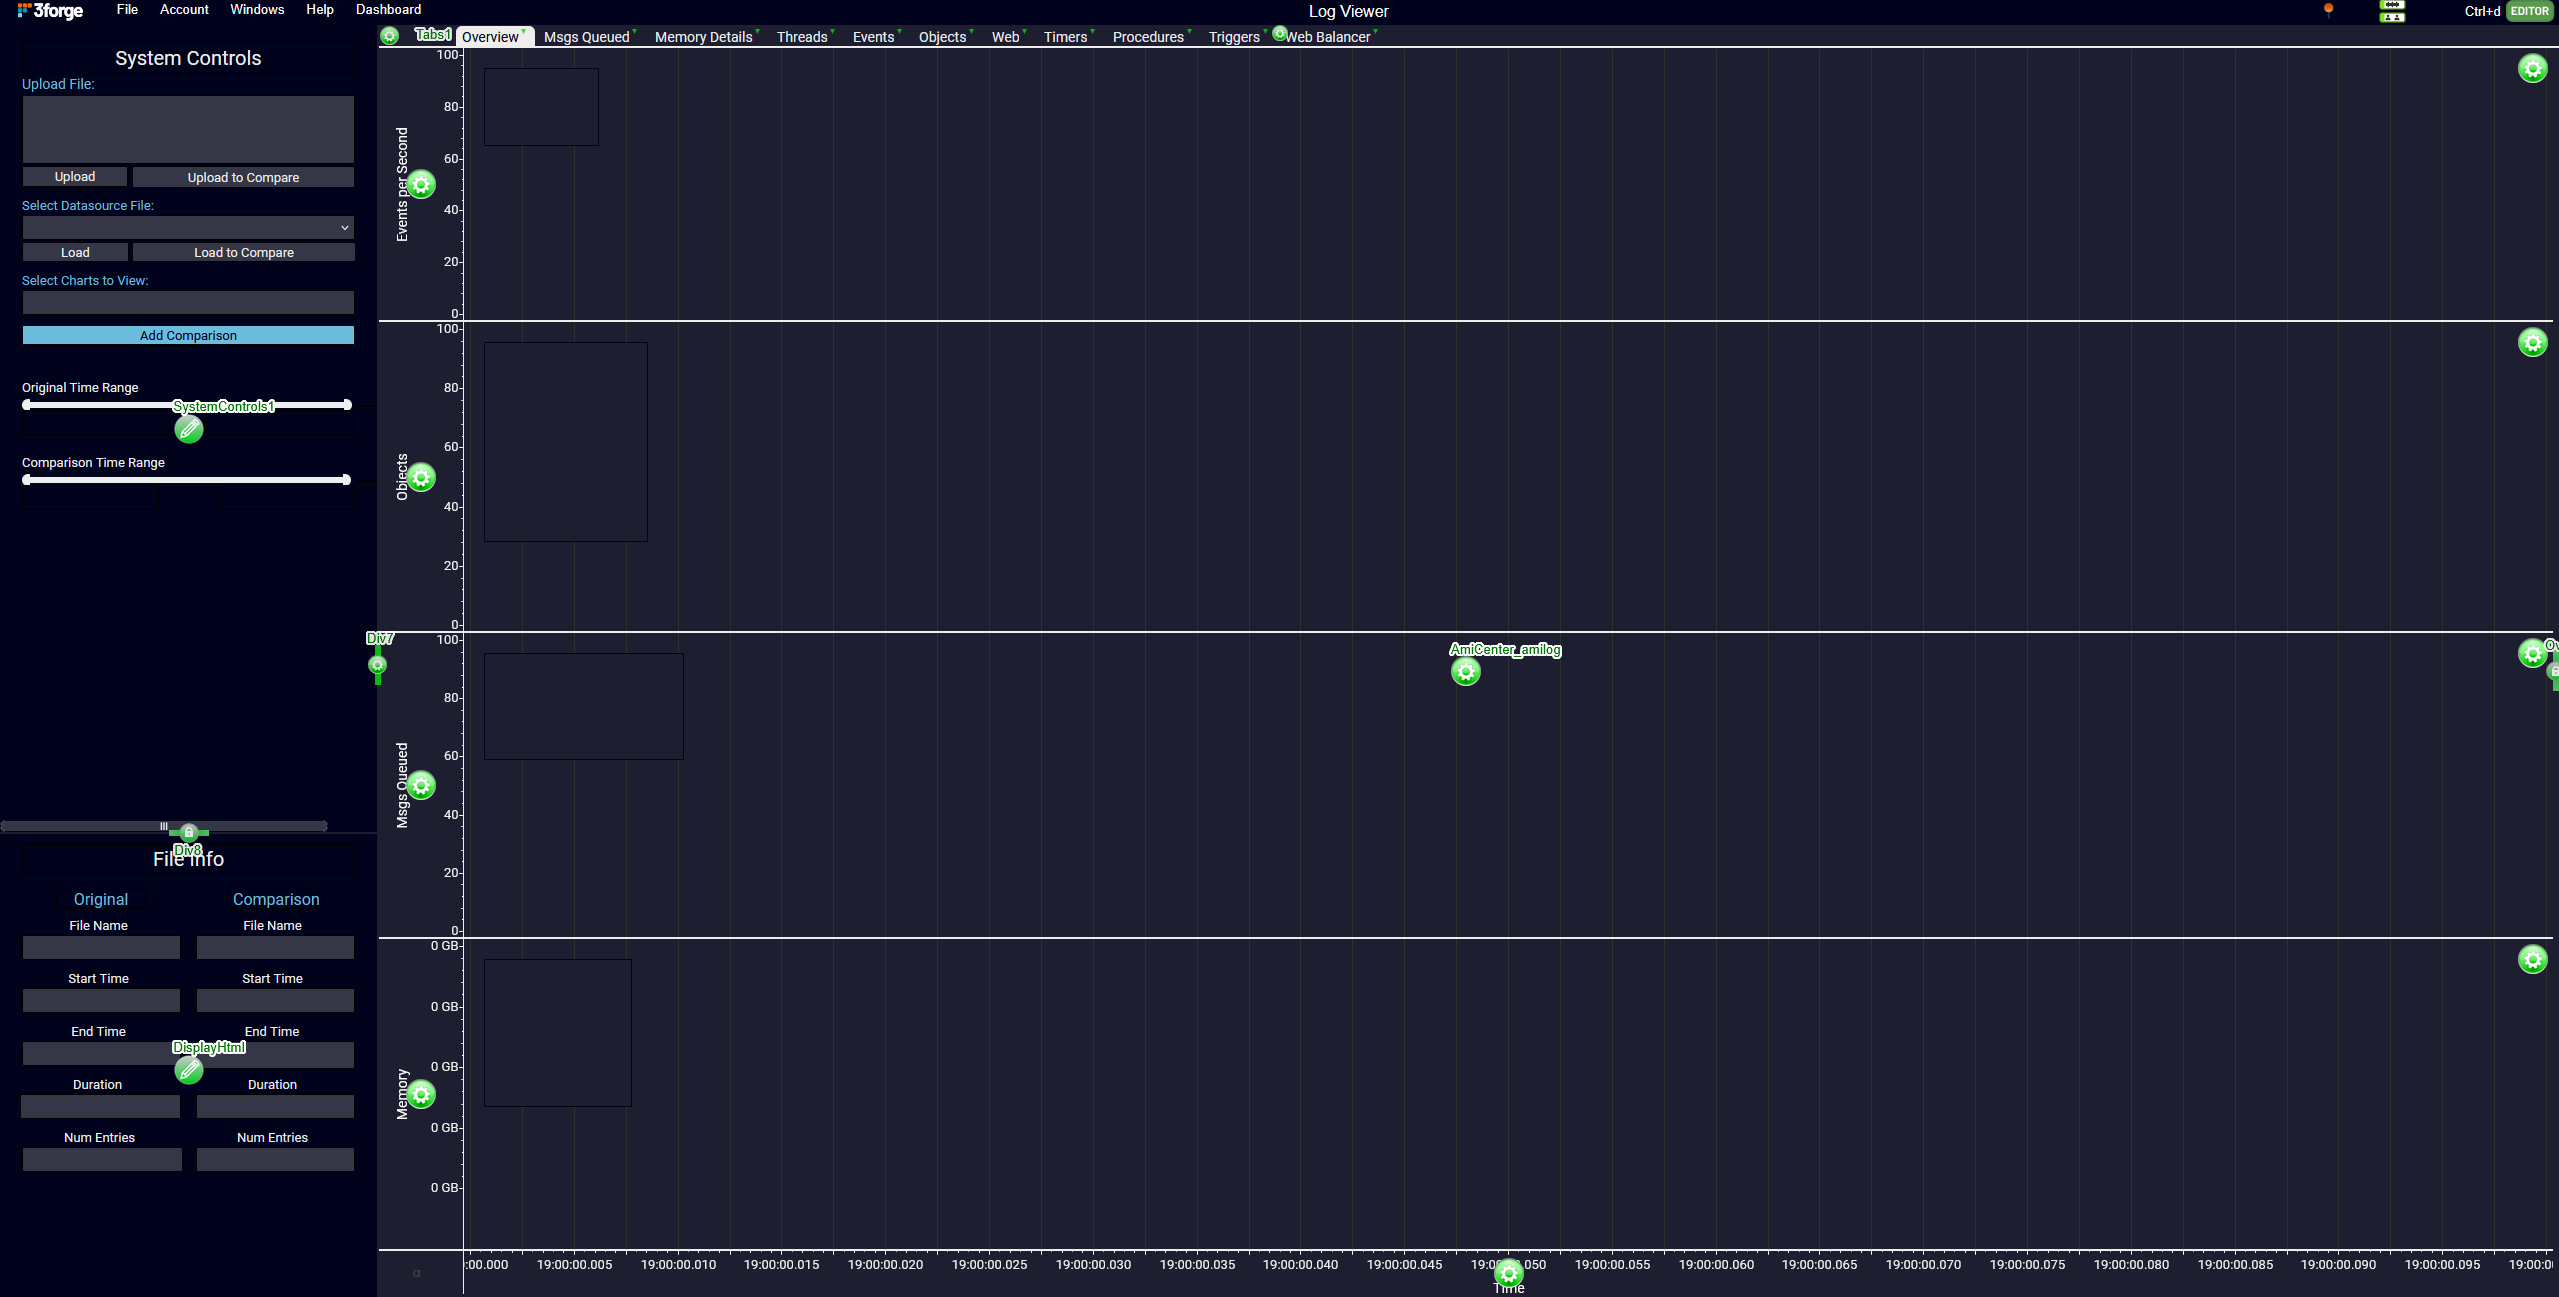
-
Download the log viewer AMI layout (or copy the JSON).
-
Open the
logviewer_old.amifile in AMI via File -> Open -> (select the appropriate option based on the file location) or paste the layout JSON in the import window under File -> Import.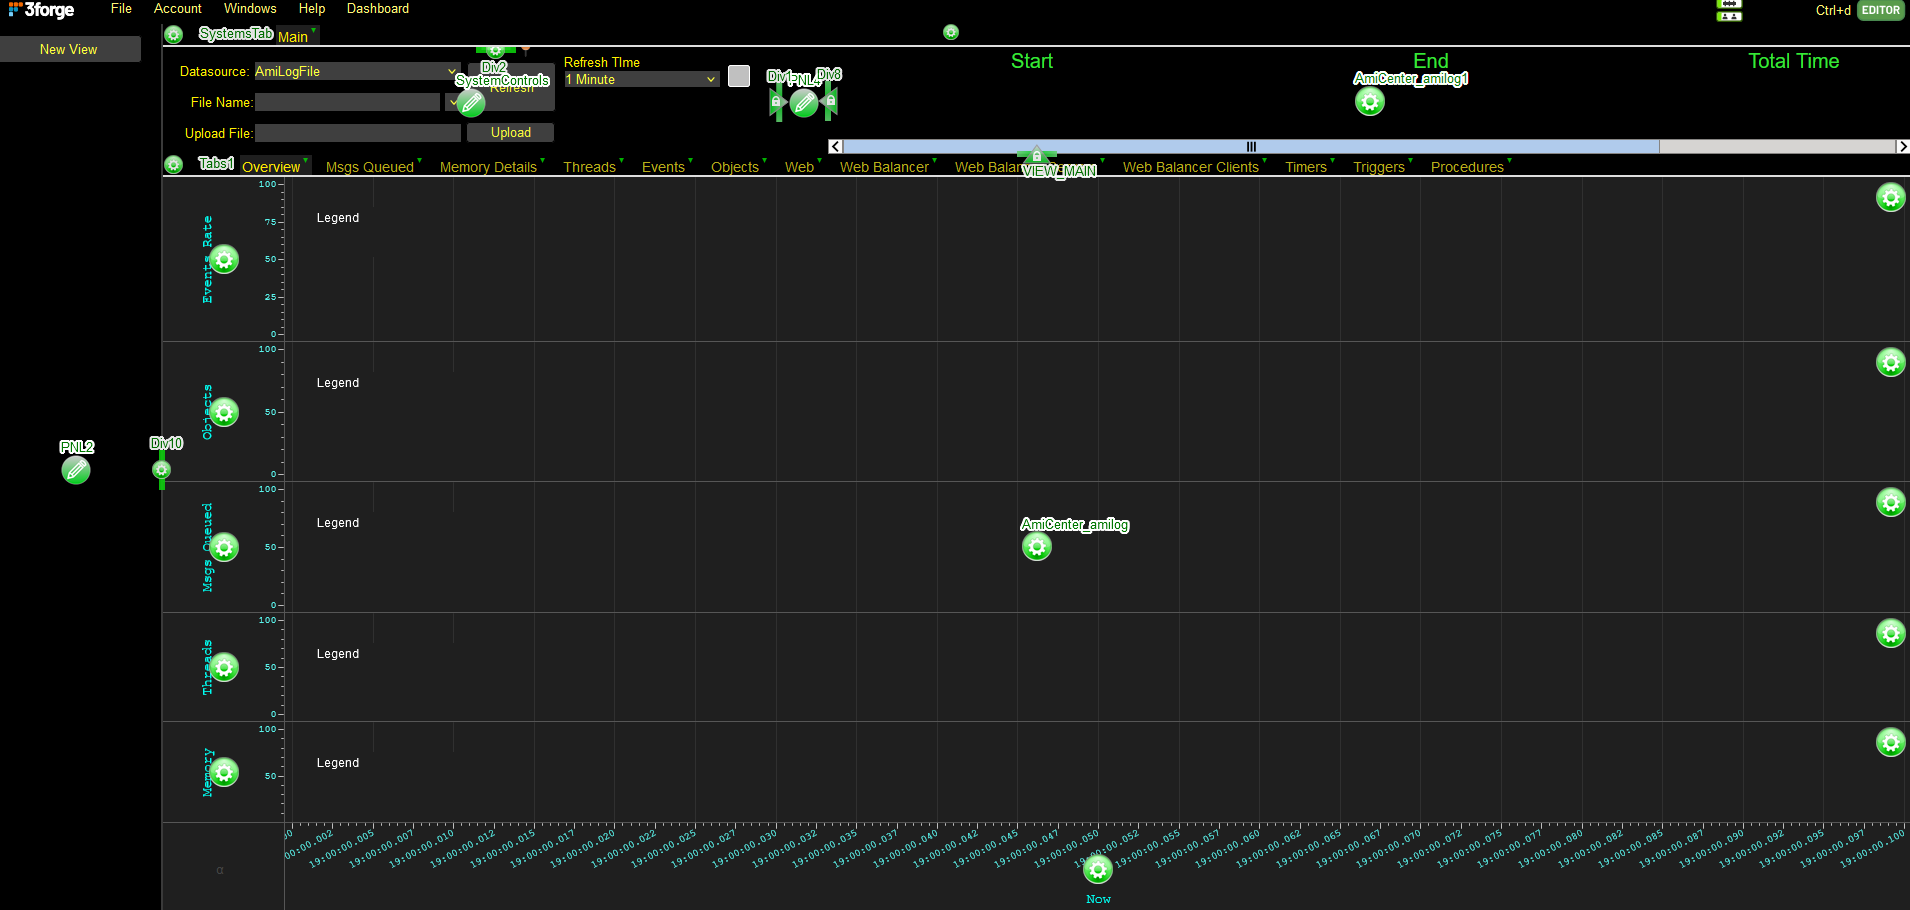
The log viewer can either read files uploaded via the "Upload File" field (under "System Controls" on the left-hand side) or from the "AmiLogFile" datasource.
The "AmiLogFile" datasource references a directory containing log files and must be supplied by the user.
Navigate to the Data Modeler under Dashboard -> Data Modeler and create a new "Flat File Reader" datasource titled "AmiLogFile" configuring the URL to the directory containing your log files.
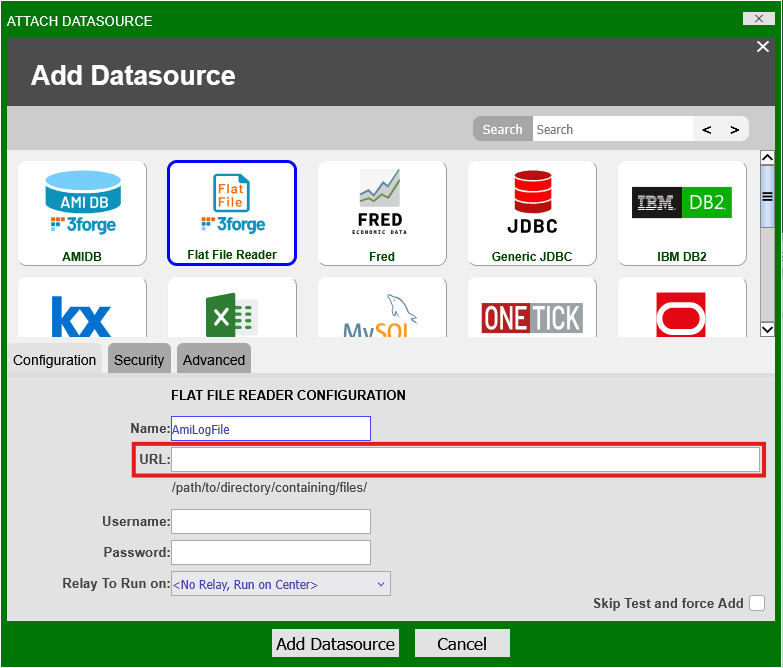
Log files in this directory can now be analyzed via the drop-down menu on the left-hand side titled "Select Datasource File."
Downloadable Files
- AMI layout file (or copy-and-paste the raw JSON text directly into AMI from here)
- Custom classes (required to run this log viewer)
Note
If you cannot download the custom classes, please reach out to us at support@3forge.com and we will assign the files to your account.
- AMI layout file (or copy-and-paste the raw JSON text directly into AMI from here)
Interpreting the Log Viewer
The log viewer is primarily intended for identifying potential memory (crashes) and performance (sluggishness) issues.
Listed below are each of the graphs displayed in the log viewer and how to interpret them.
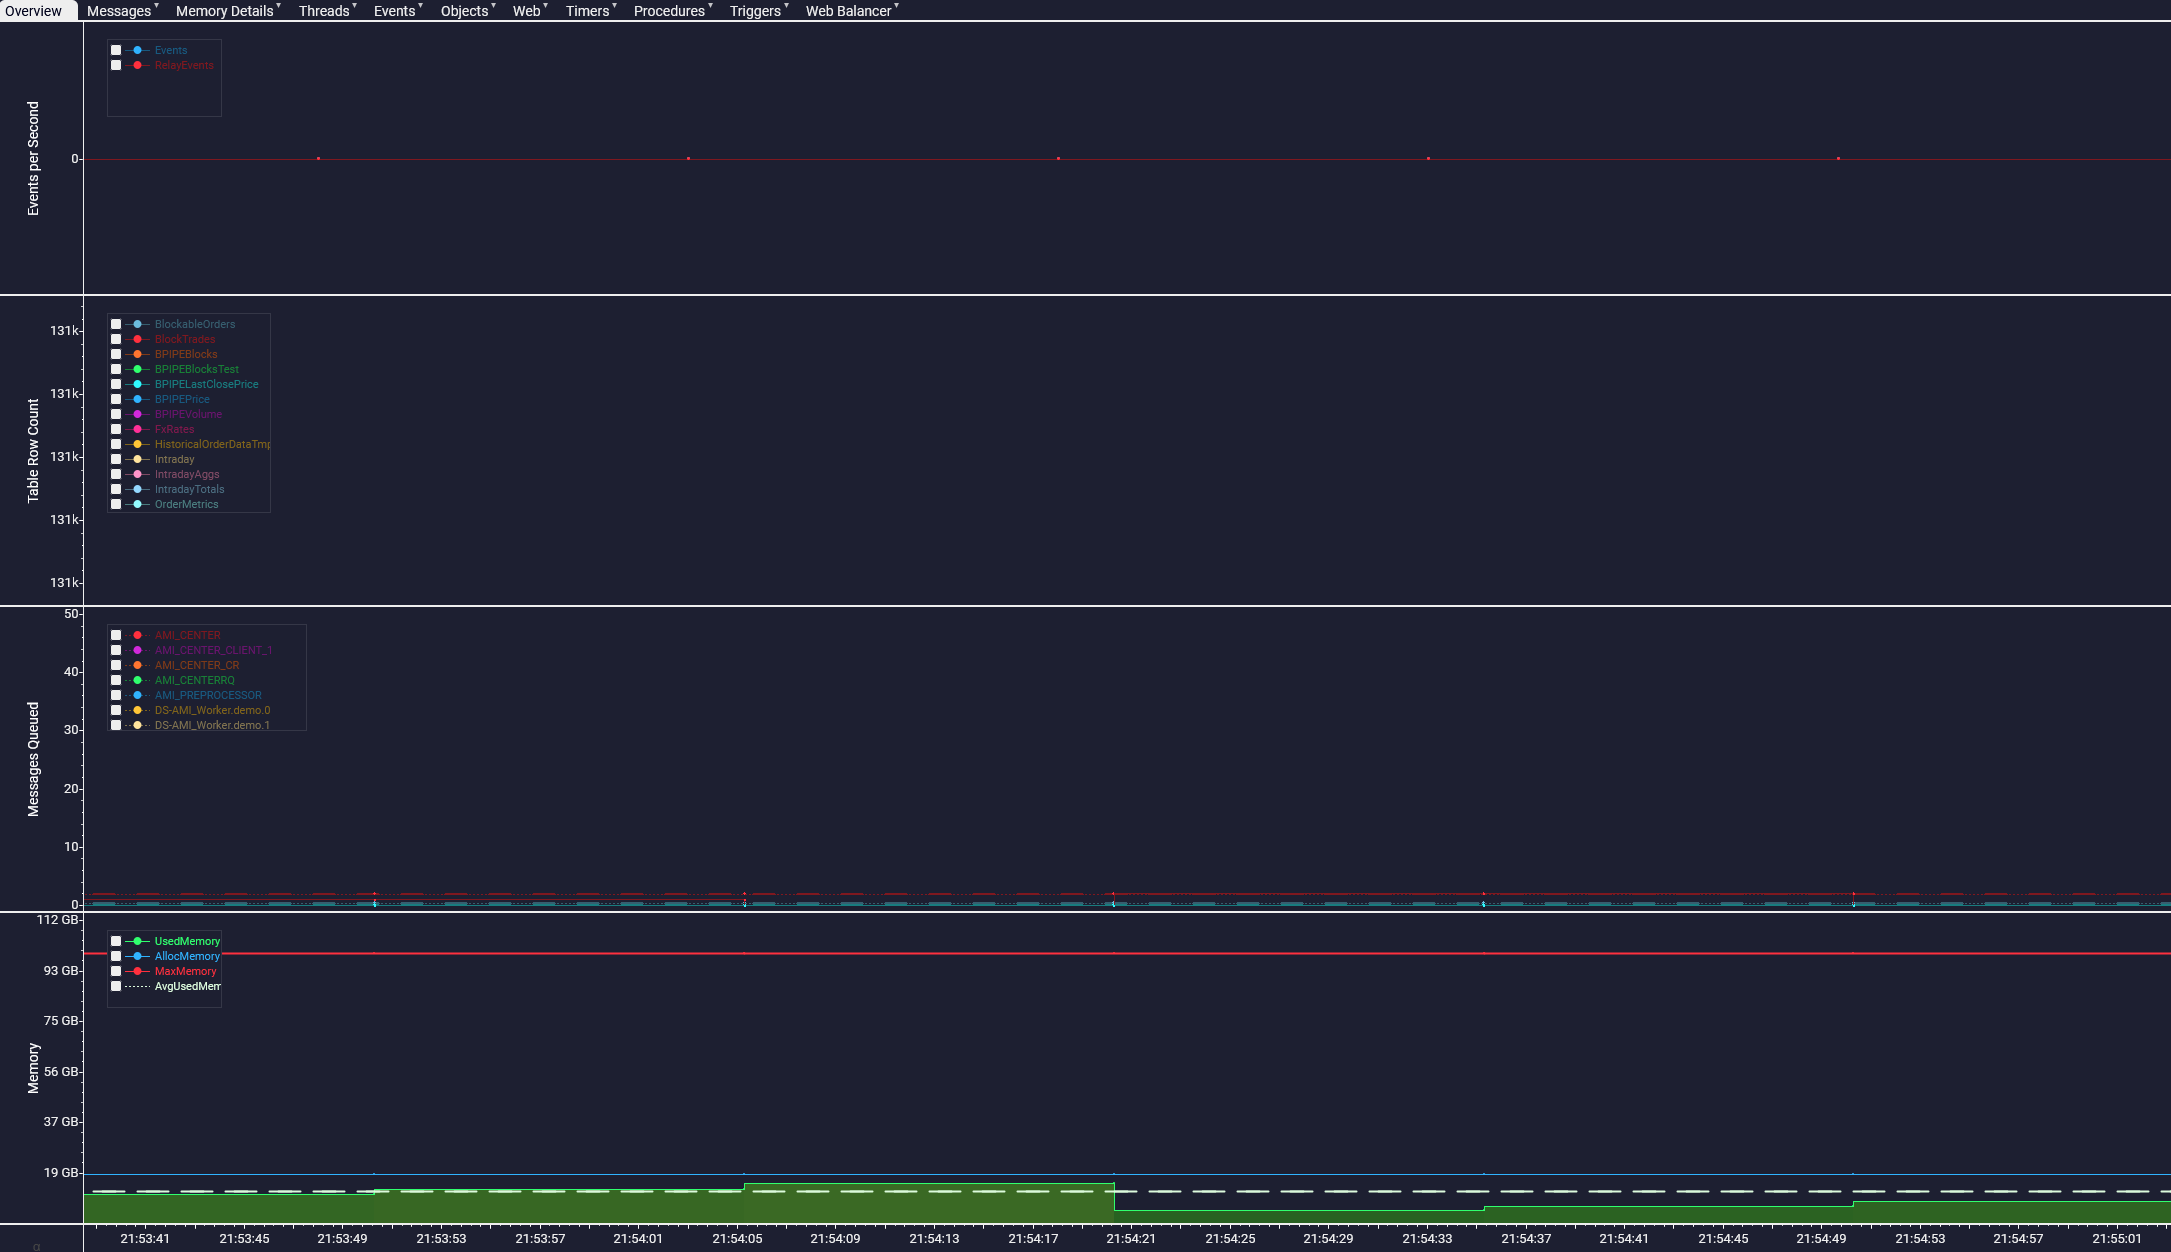
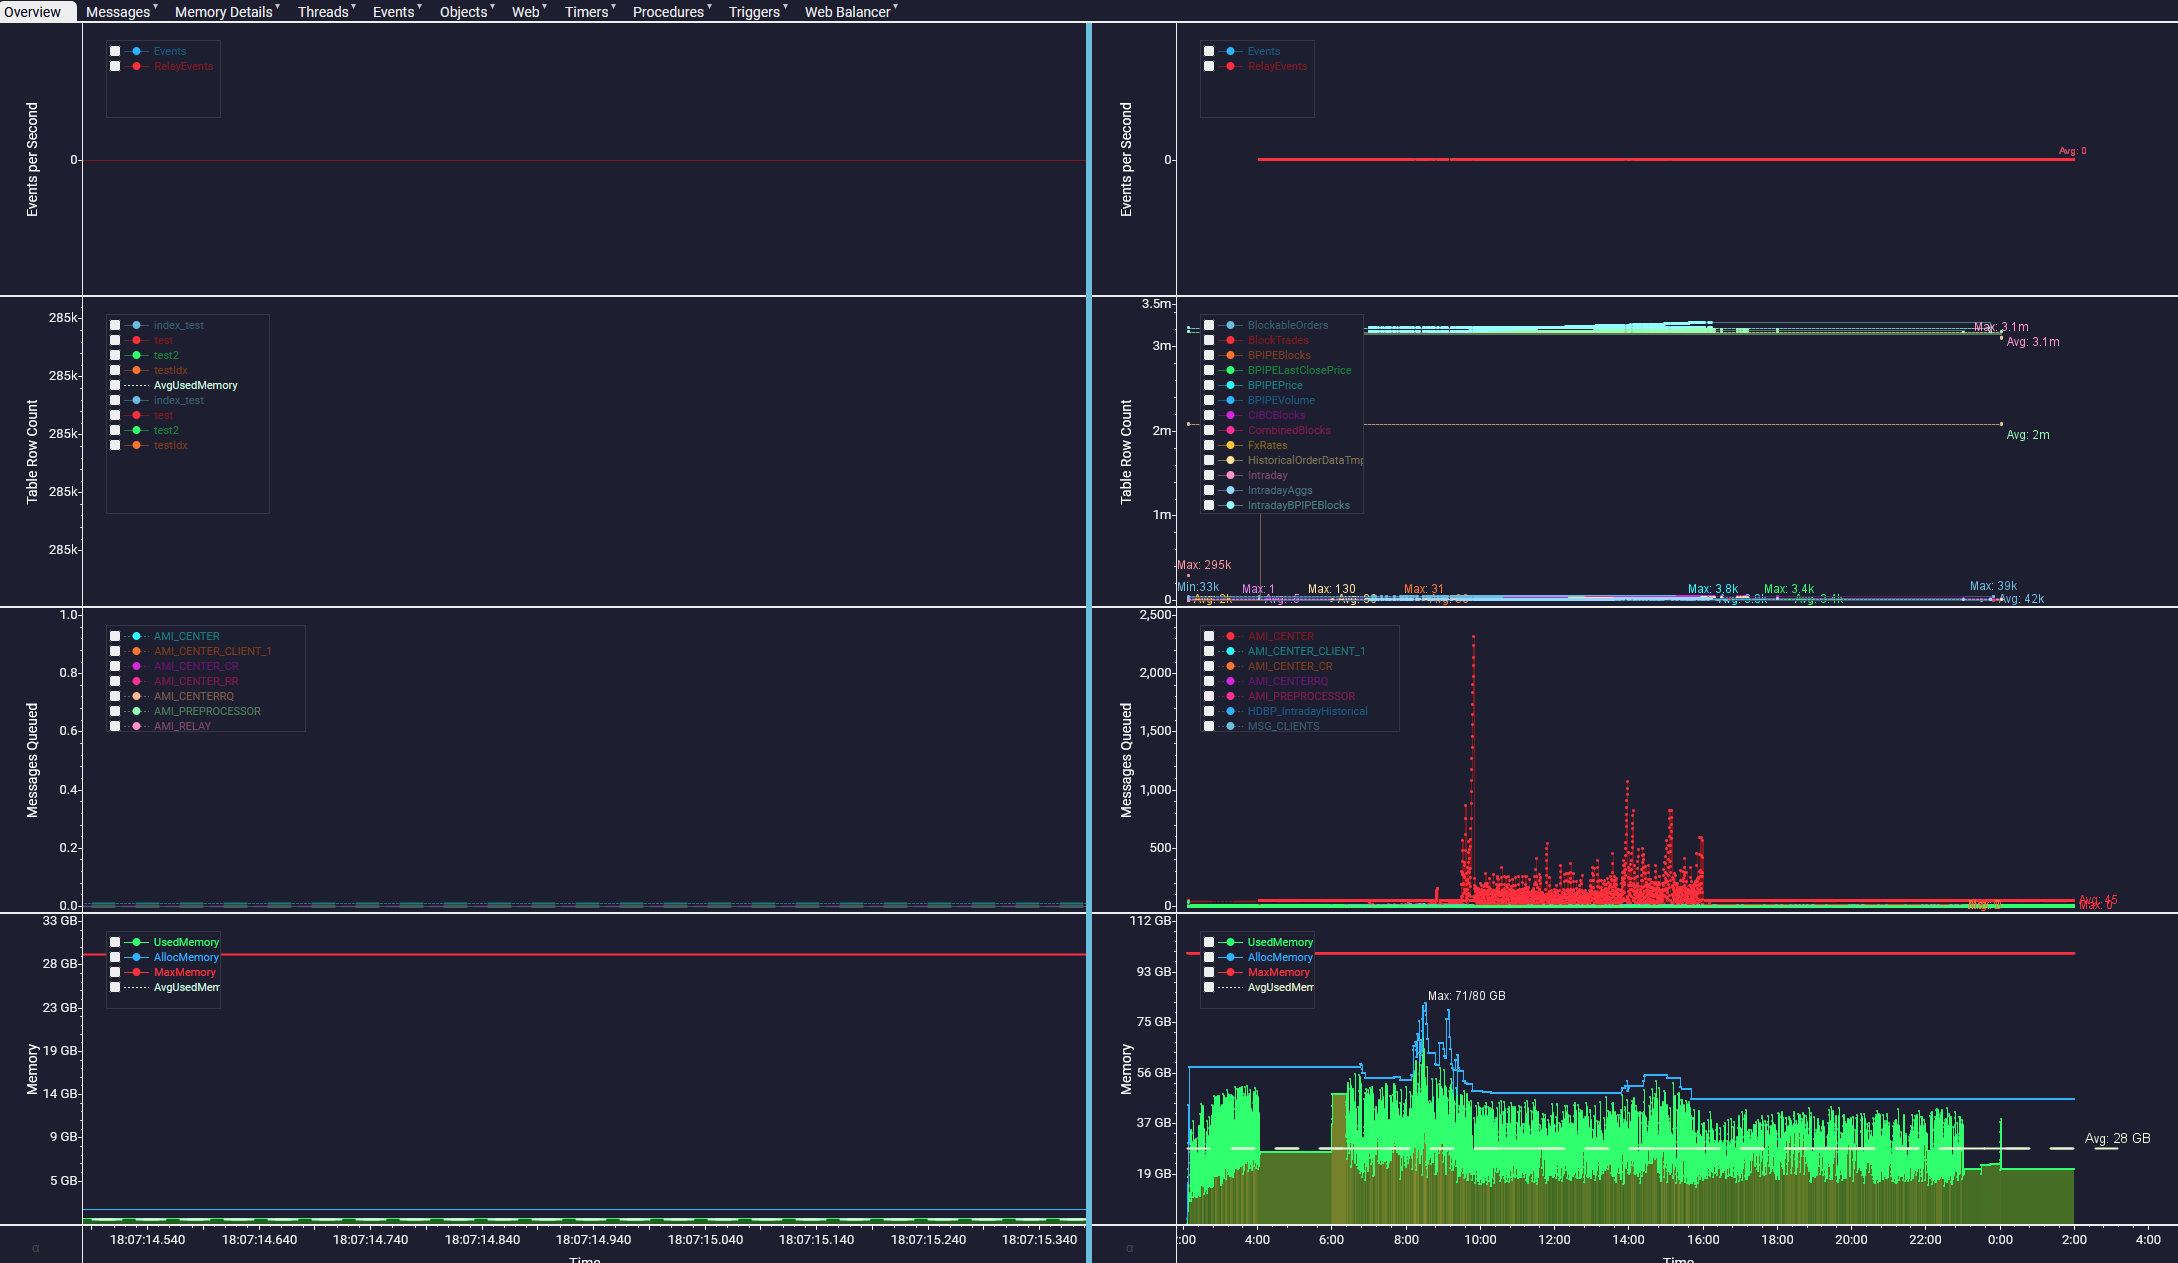
Overview
The overview tab acts as a general summary of the AMI session and contains 4 basic fields:
- Events per Second
- Table Row Count
- Messages Queued
- Memory
This will typically highlight any obvious issues. Most common performance issues can be linked back to this graph.
More detailed views of each of these metrics can be found in their own respective tabs.
Messages
The Messages tab displays message events from each possible source and contains 3 graphs:
- Messages Queued
- Added Messages/s
- Messages Processed
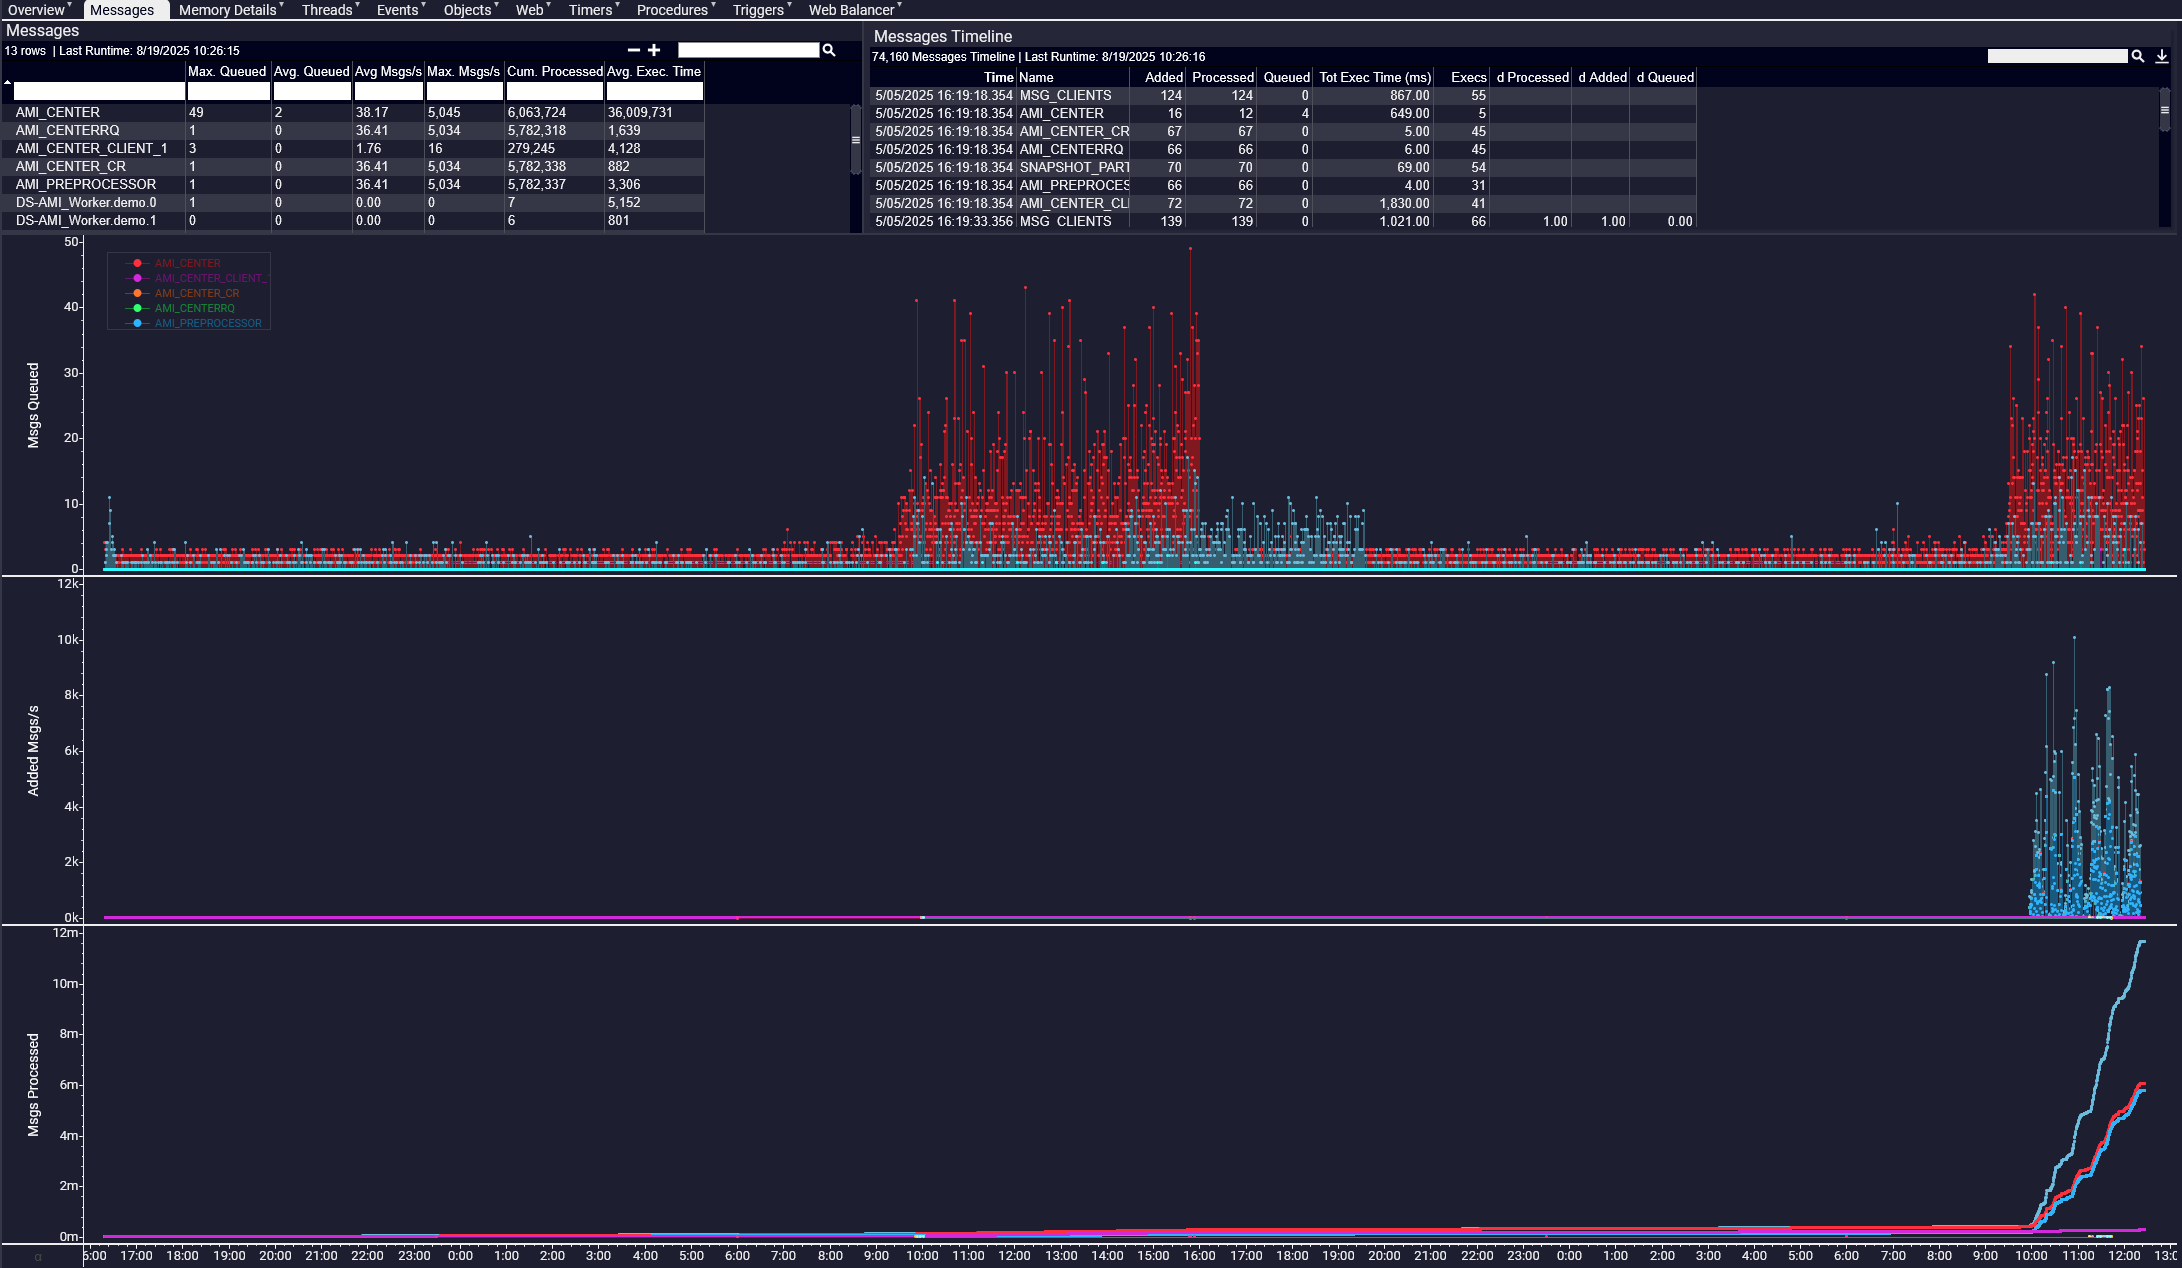
Messages Queued
-
Shows how many messages are being queued in AMI and from which source. When a message is processed, it is removed from the queue.
-
High values are not an immediate cause for concern, provided the messages are being cleared (a steady stream of messages being processed).
-
An increase in messages over time (a sharp gradient) shows messages are not being cleared fast enough as new ones arrive. This could indicate issues with timers and triggers and may result in AMI behaving slowly.
Added Messages/s
-
Shows messages that are being received by the Center but have not been processed yet.
-
Offers insight into the activity level of messages received, which can be helpful in identifying trends such as peak data influx times.
Messages Processed
- Shows the messages which have already been processed. This is rarely a point of concern.
Memory Details
The memory graph shows 3 pieces of information: used memory (green), allocated memory (blue), and the maximum memory capacity allocated to AMI by your system (red).
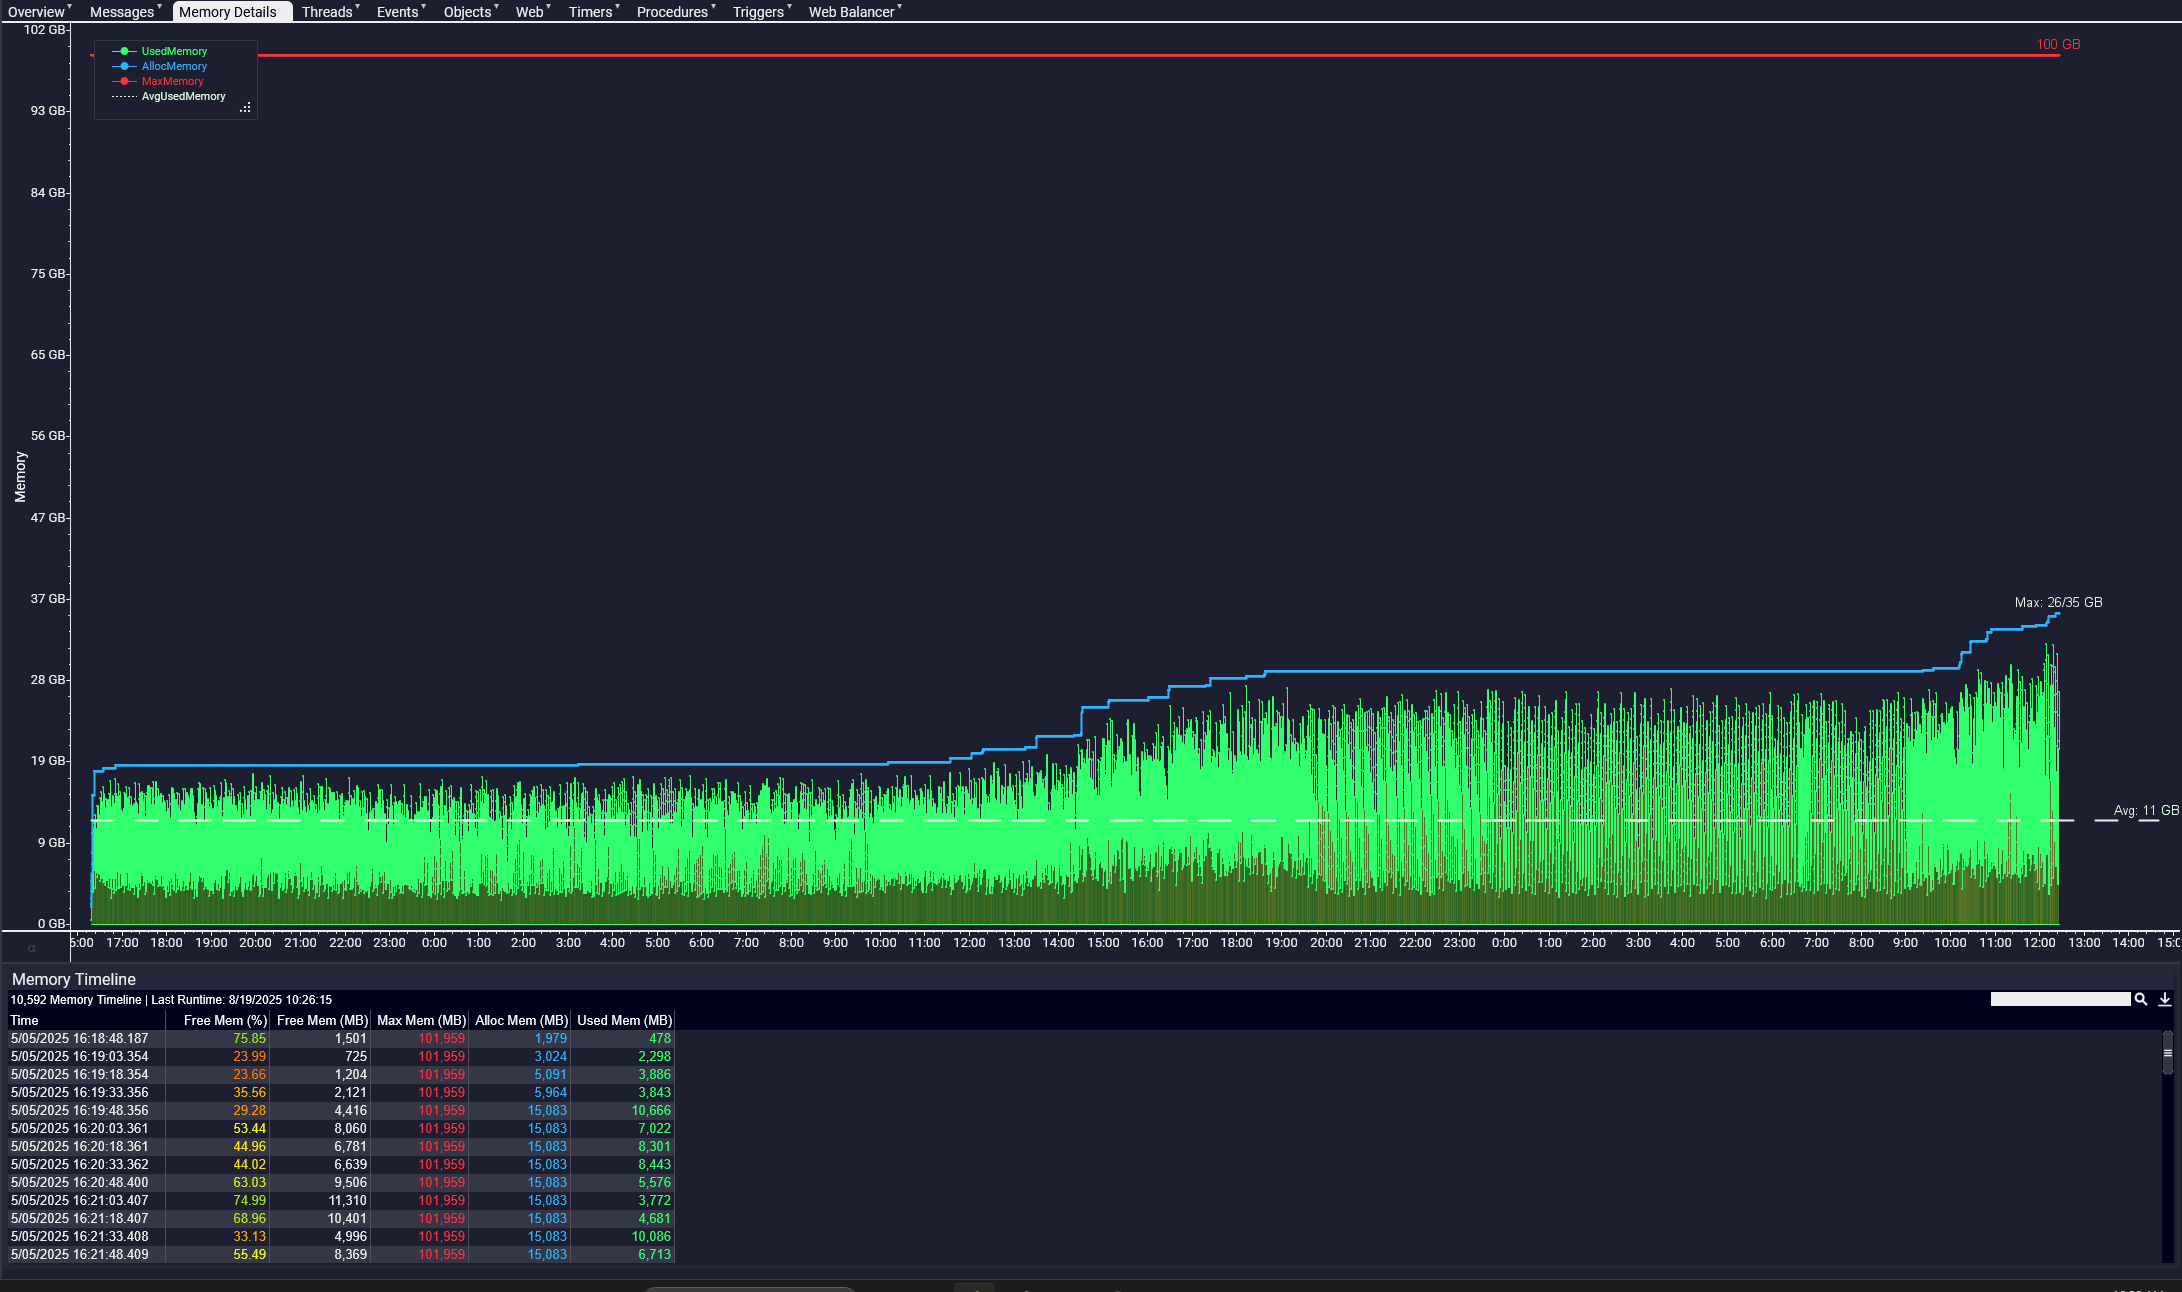
This shows how the JVM requests and allocates memory for AMI. The JVM will continually perform garbage collection, but may periodically do large garbage cleans if the memory use approaches the allocated threshold. At this point, the JVM will then request more memory from the OS assuming the maximum memory threshold has not been exceeded.
The JVM allocates and requests memory from the OS automatically. In cases where the JVM requires more memory but the OS cannot release that memory to the JVM, this can cause crashes.
To avoid dynamic JVM behavior, you can change the minimum memory to match the maximum allocated memory. Add the following options to your Java VM Properties, replacing
Threads
There are 5 types of threads: waiting, timed waiting, runnable, new, and blocked. This tab visuazlizes the amount of each type of thread at any given time.
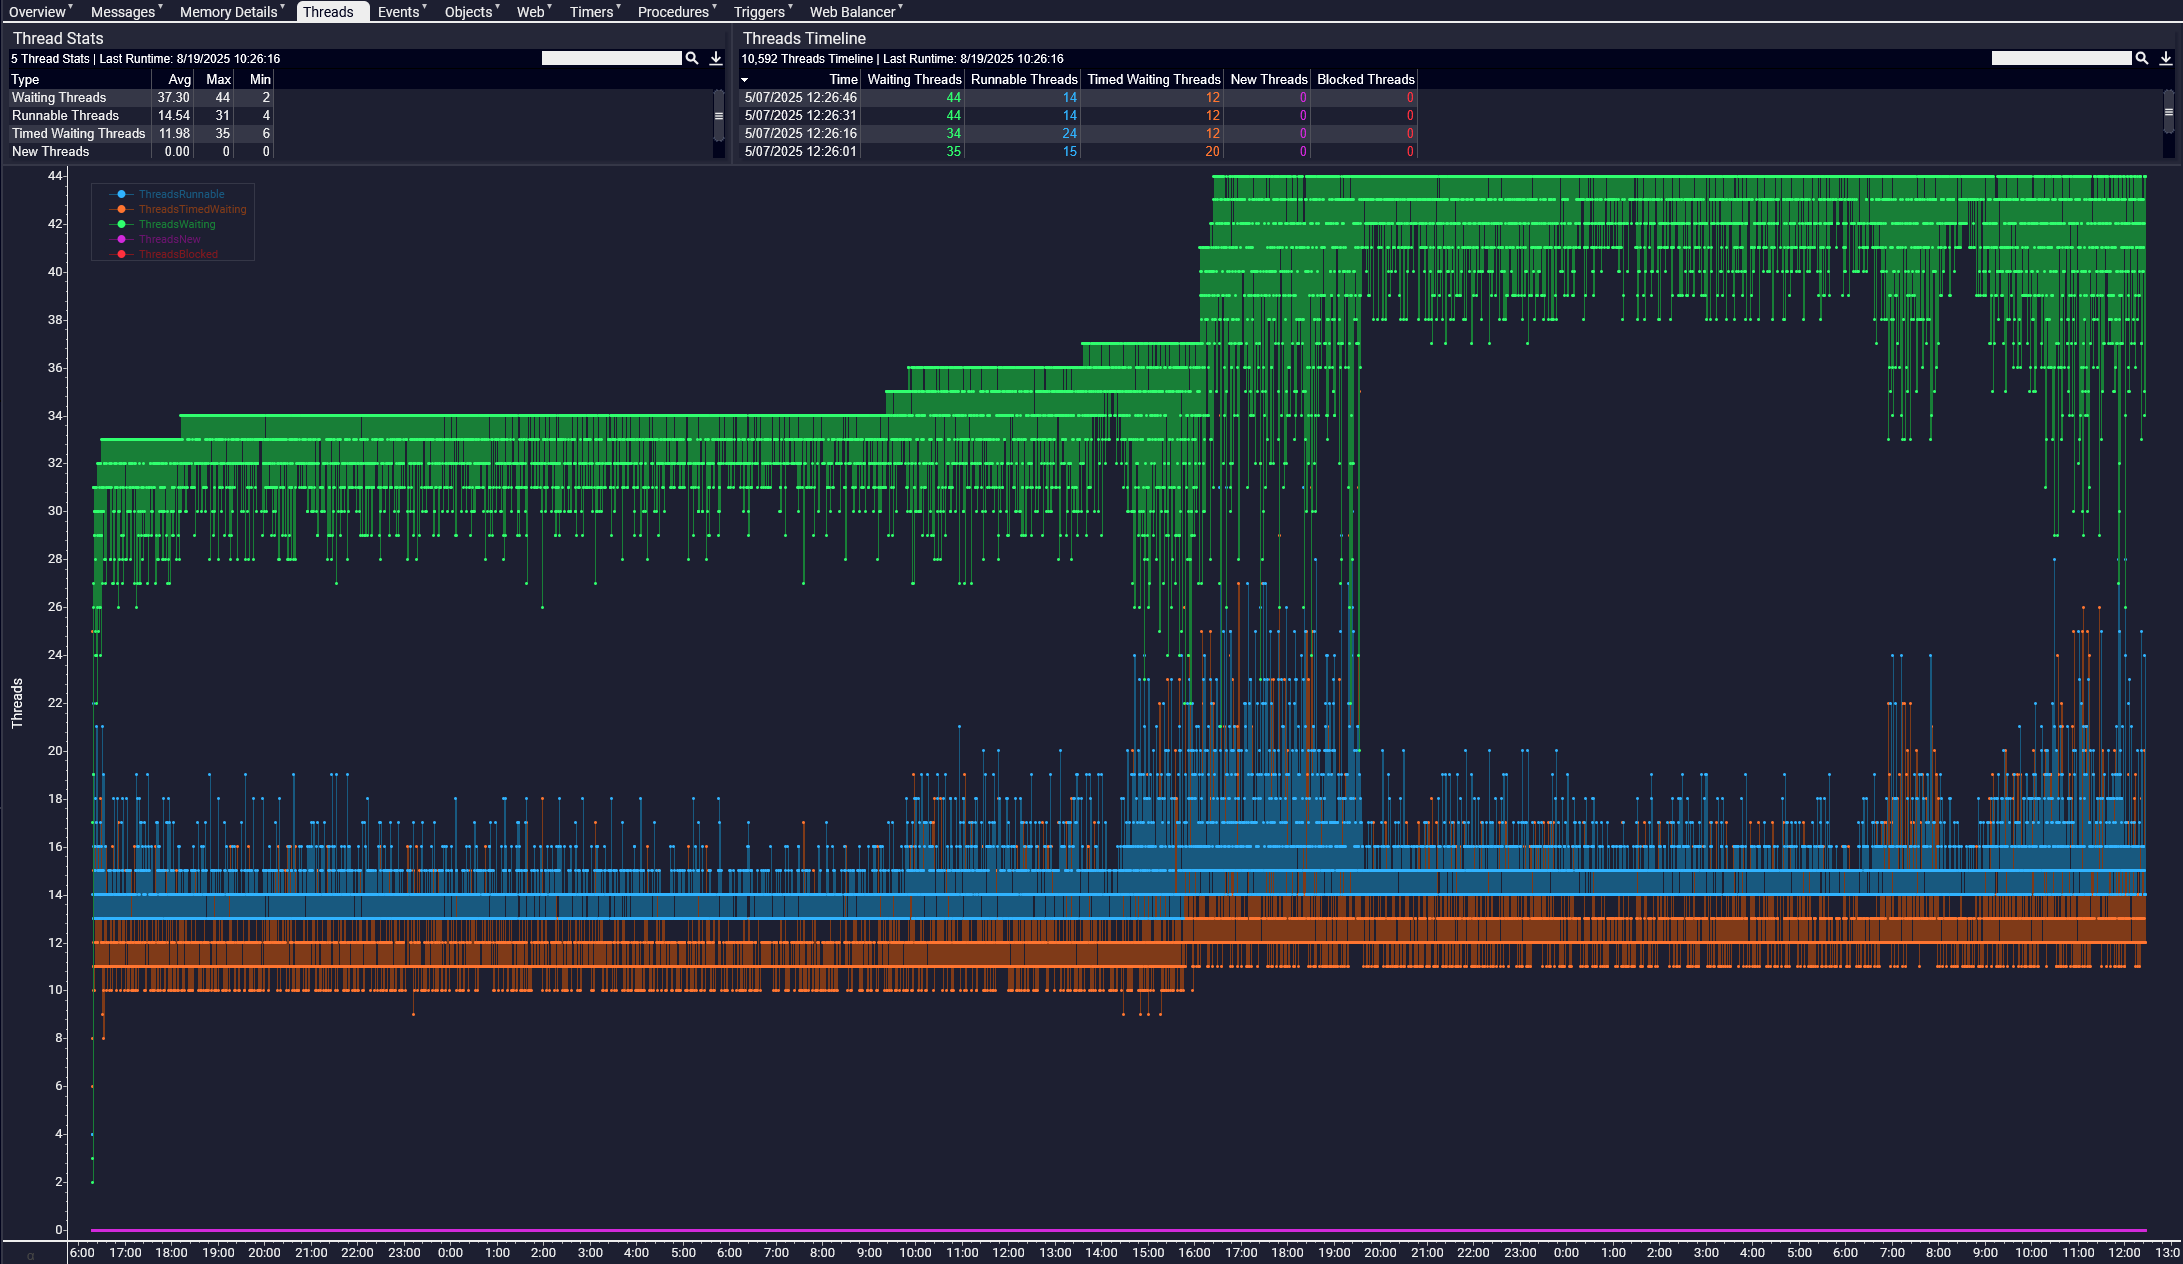
A legend is included in the log viewer dashboard.
Events
In the 3forge platform, events are messages sent or received by the Center, while relay events are those packets of information handled by the relay. There are 2 graphs in this tab: Total Events, and Events/s.
Event graphs are useful for identifying issues unrelated to AMI.
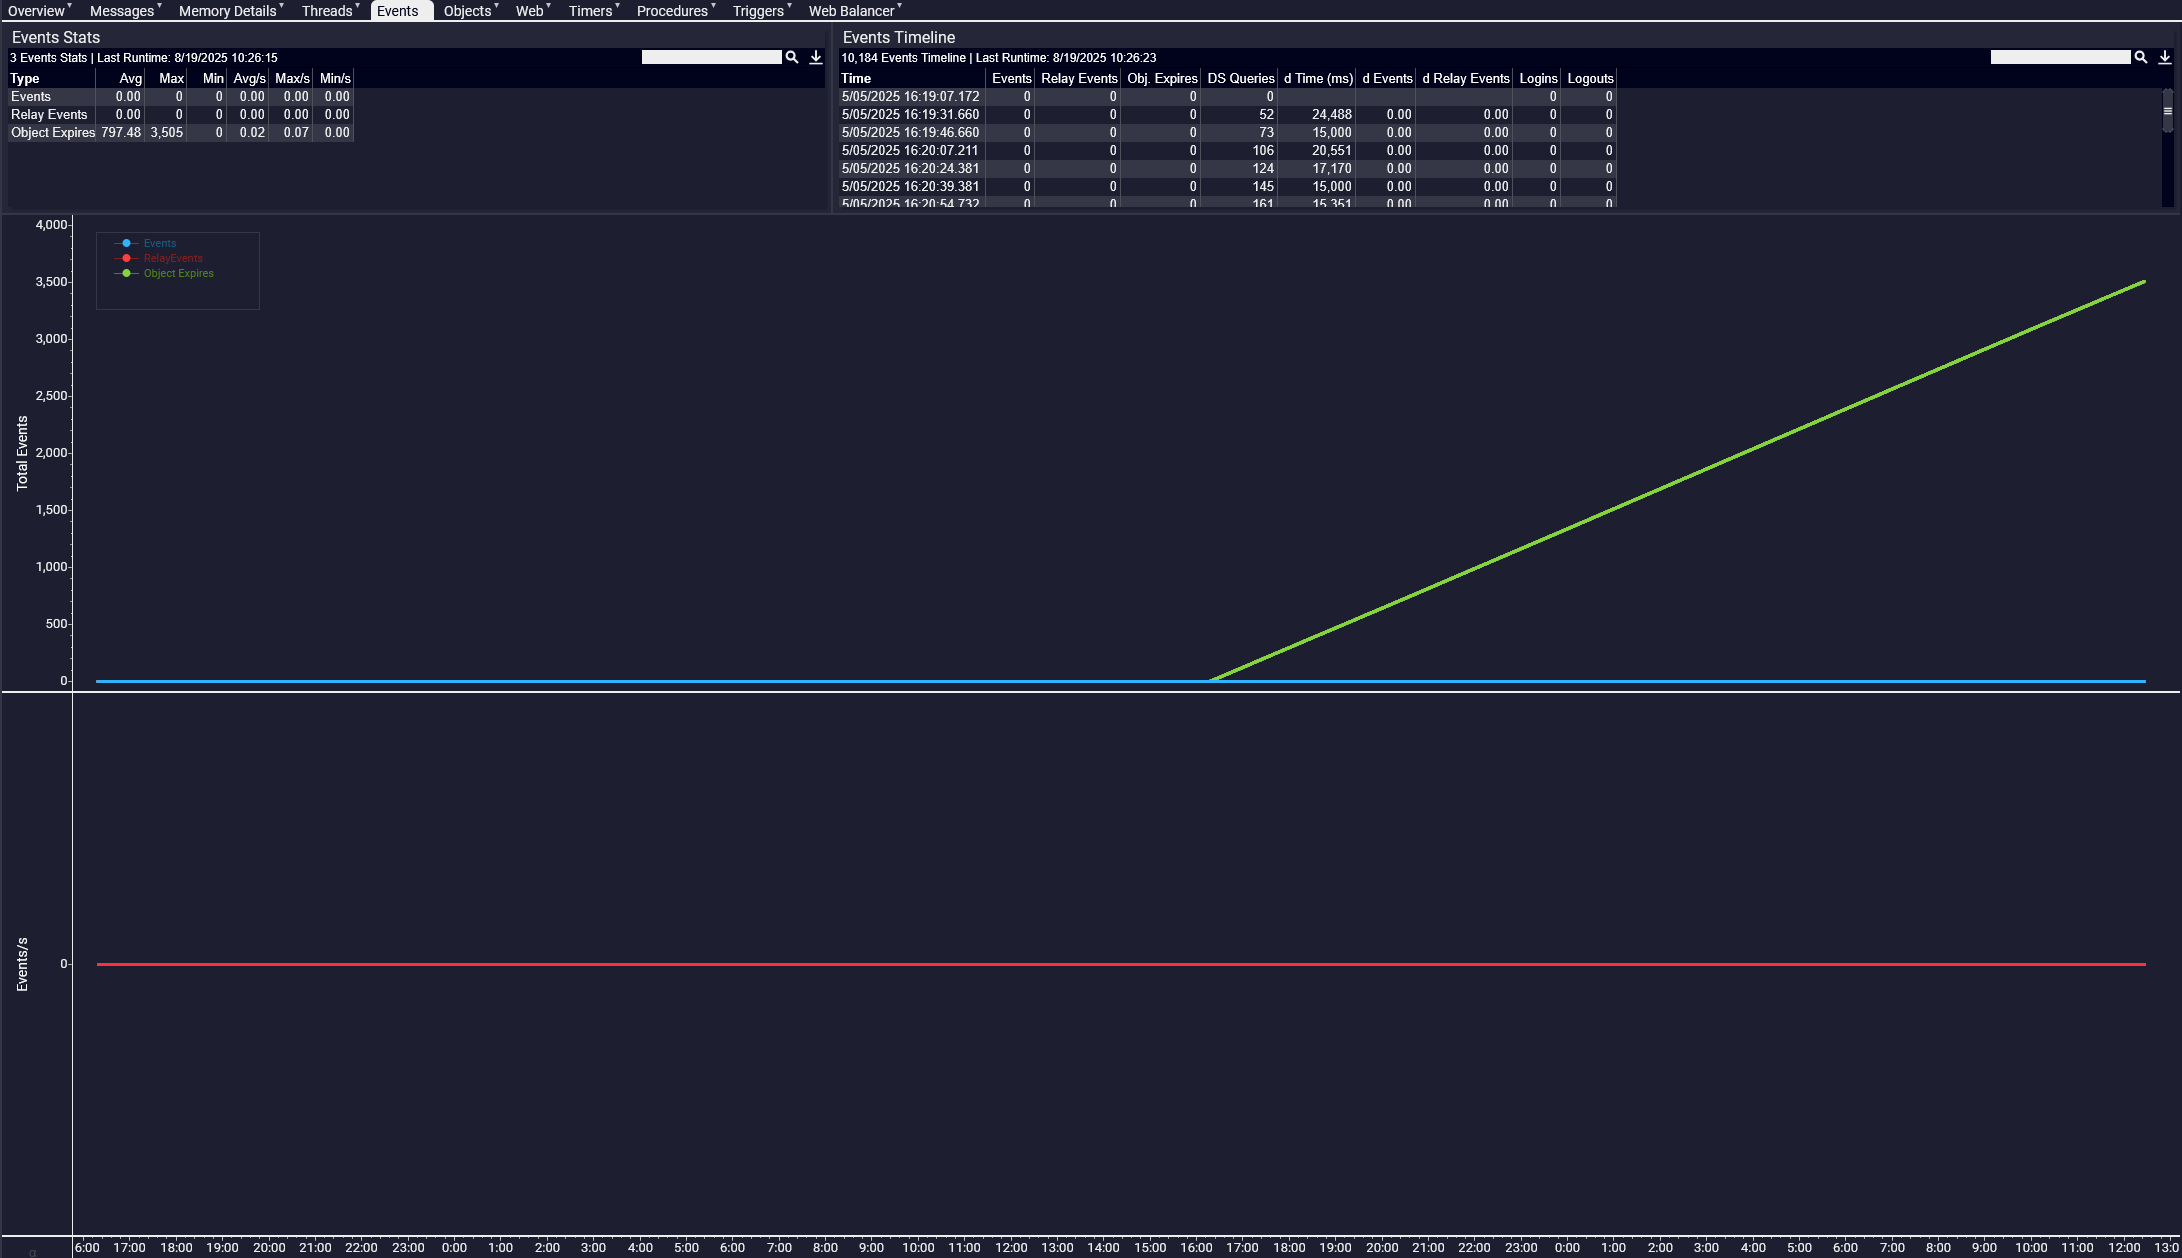
Total Events is a cumulative graph that should only ever increase, while observing peaks in Events/s usually means the external feeds that your application subscribes to is experiencing a high volume of data traffic or issues on their end.
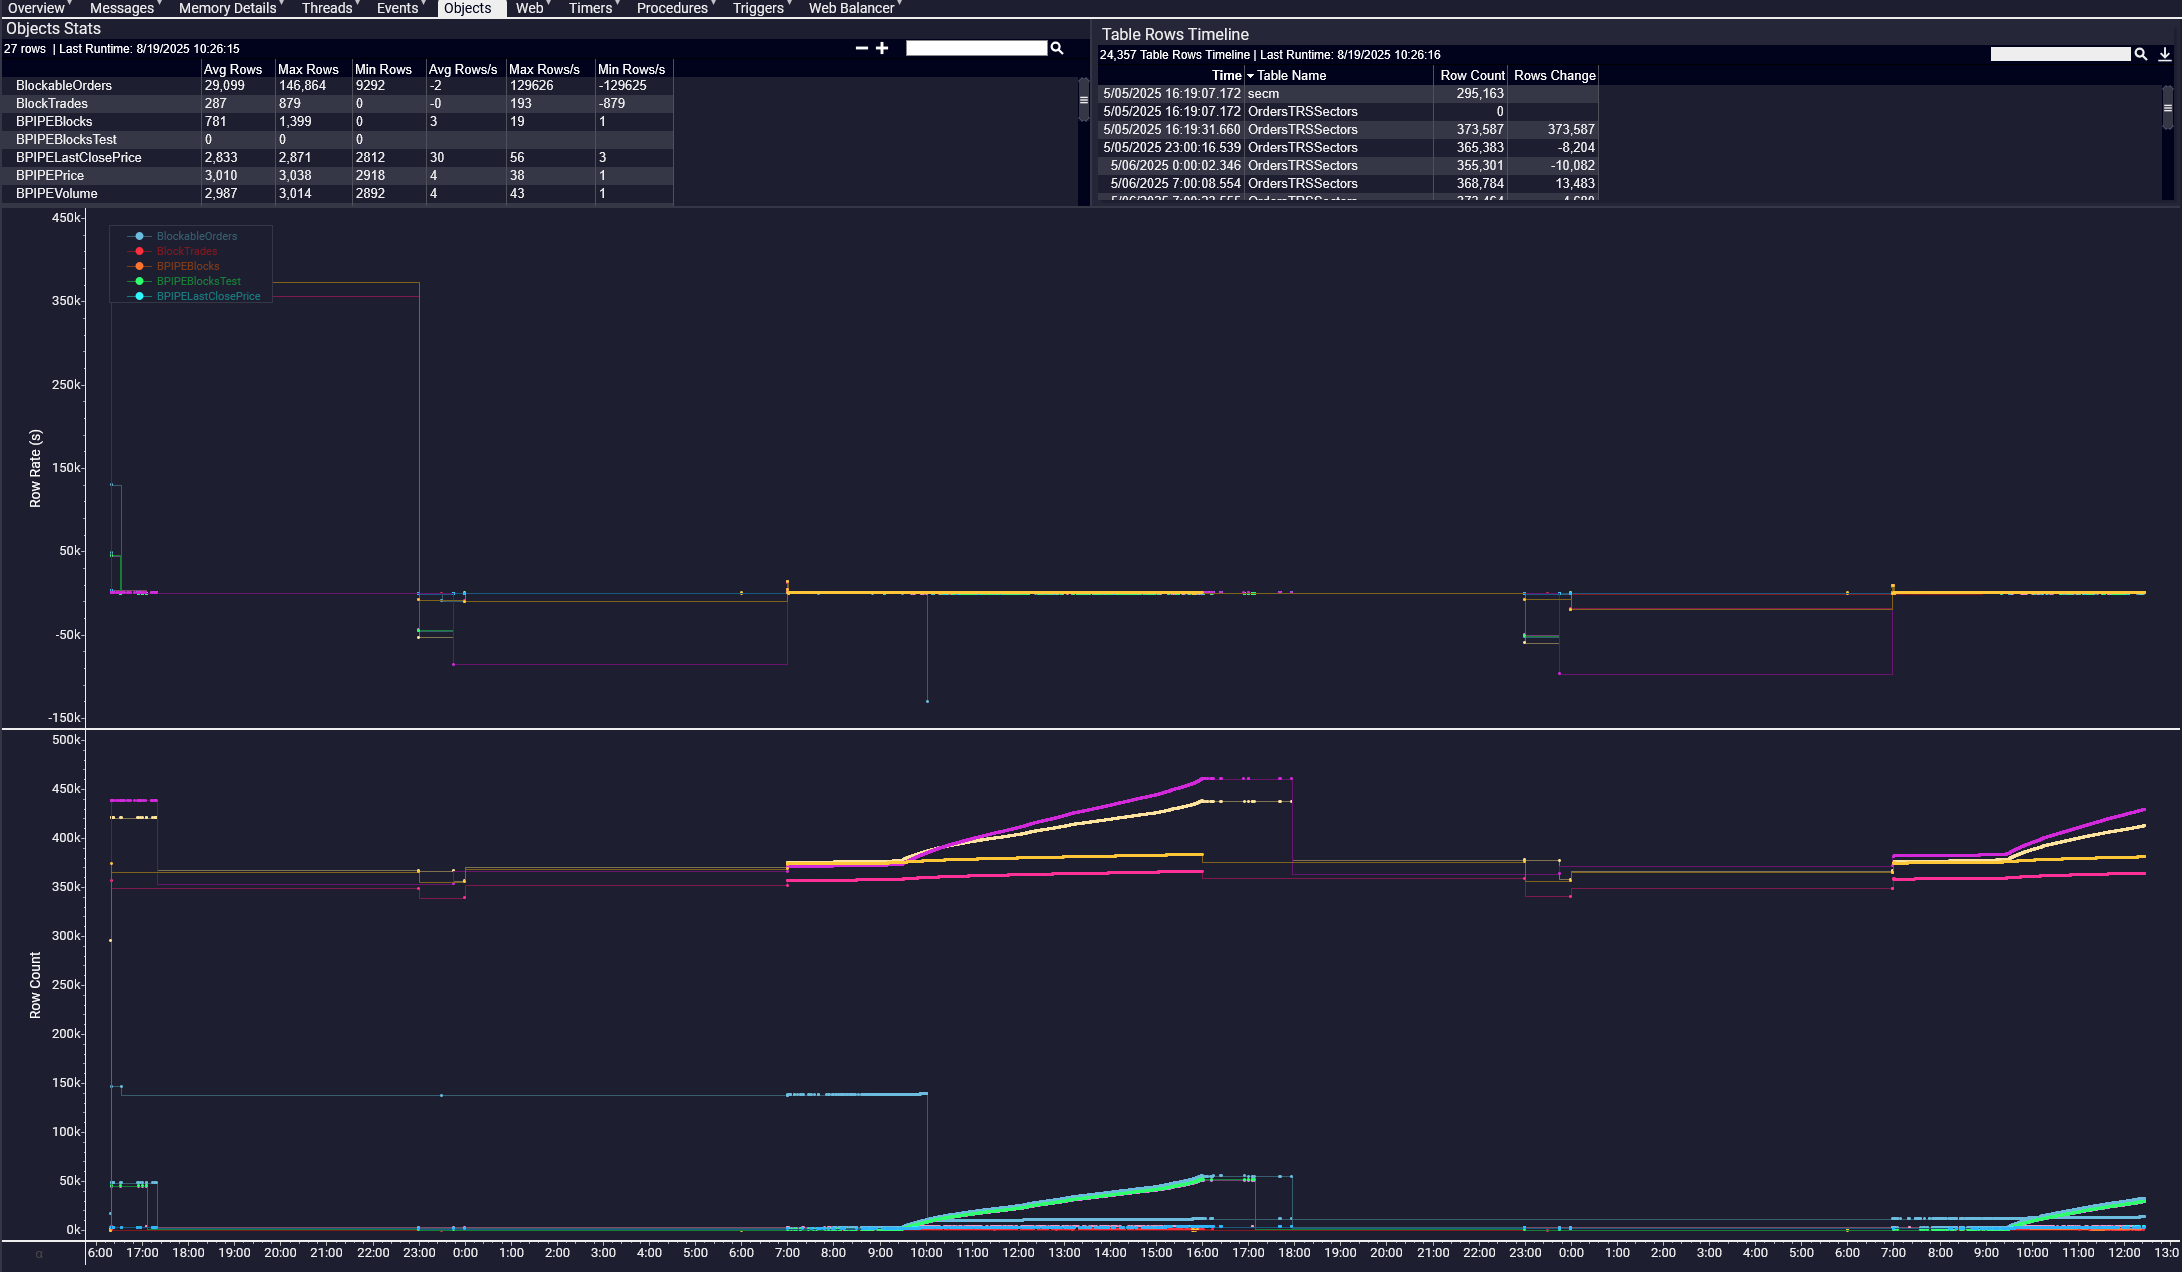
Objects
This graph shows the row counts for tables in the center and when new rows are added.
Web
This tab measures 3 parameters:
-
Active Sessions: the number of active sessions.
-
HTTP Services: the number of messages being sent between the server and a user's browser/session.
-
Rows: important for understanding memory usage. Generally speaking, the more rows, the more memory is consumed.
-
Cached rows (green) are for datamodels that run on subscription
-
User rows (red) are those in static models
-
User hidden rows (yellow) are those rows hidden in the Web but present in datamodels
-
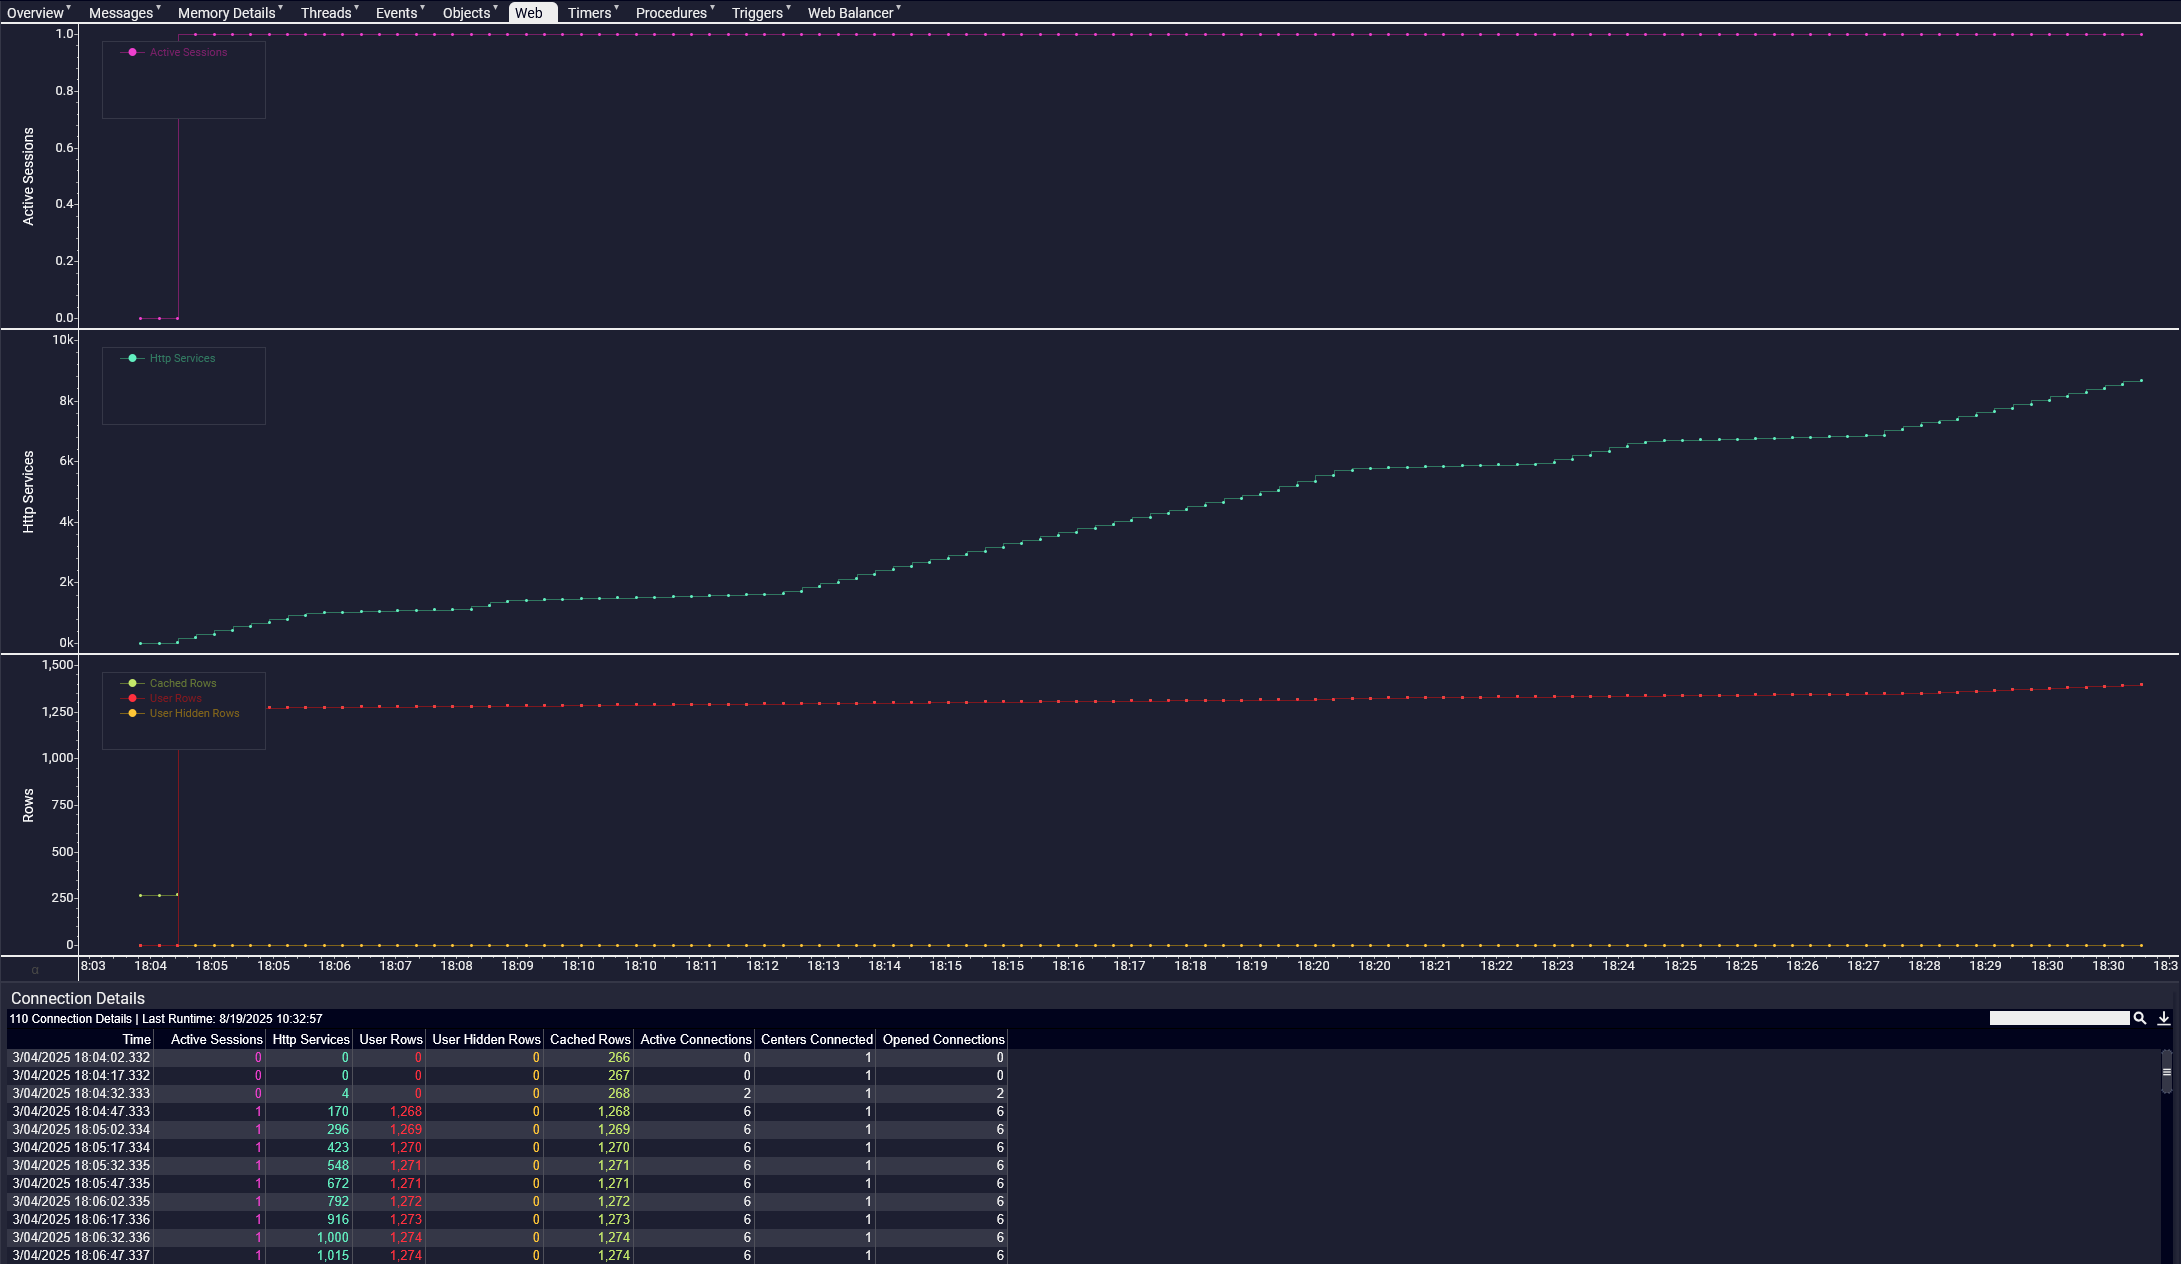
These charts can be used to identify redundant or data-intensive rows.
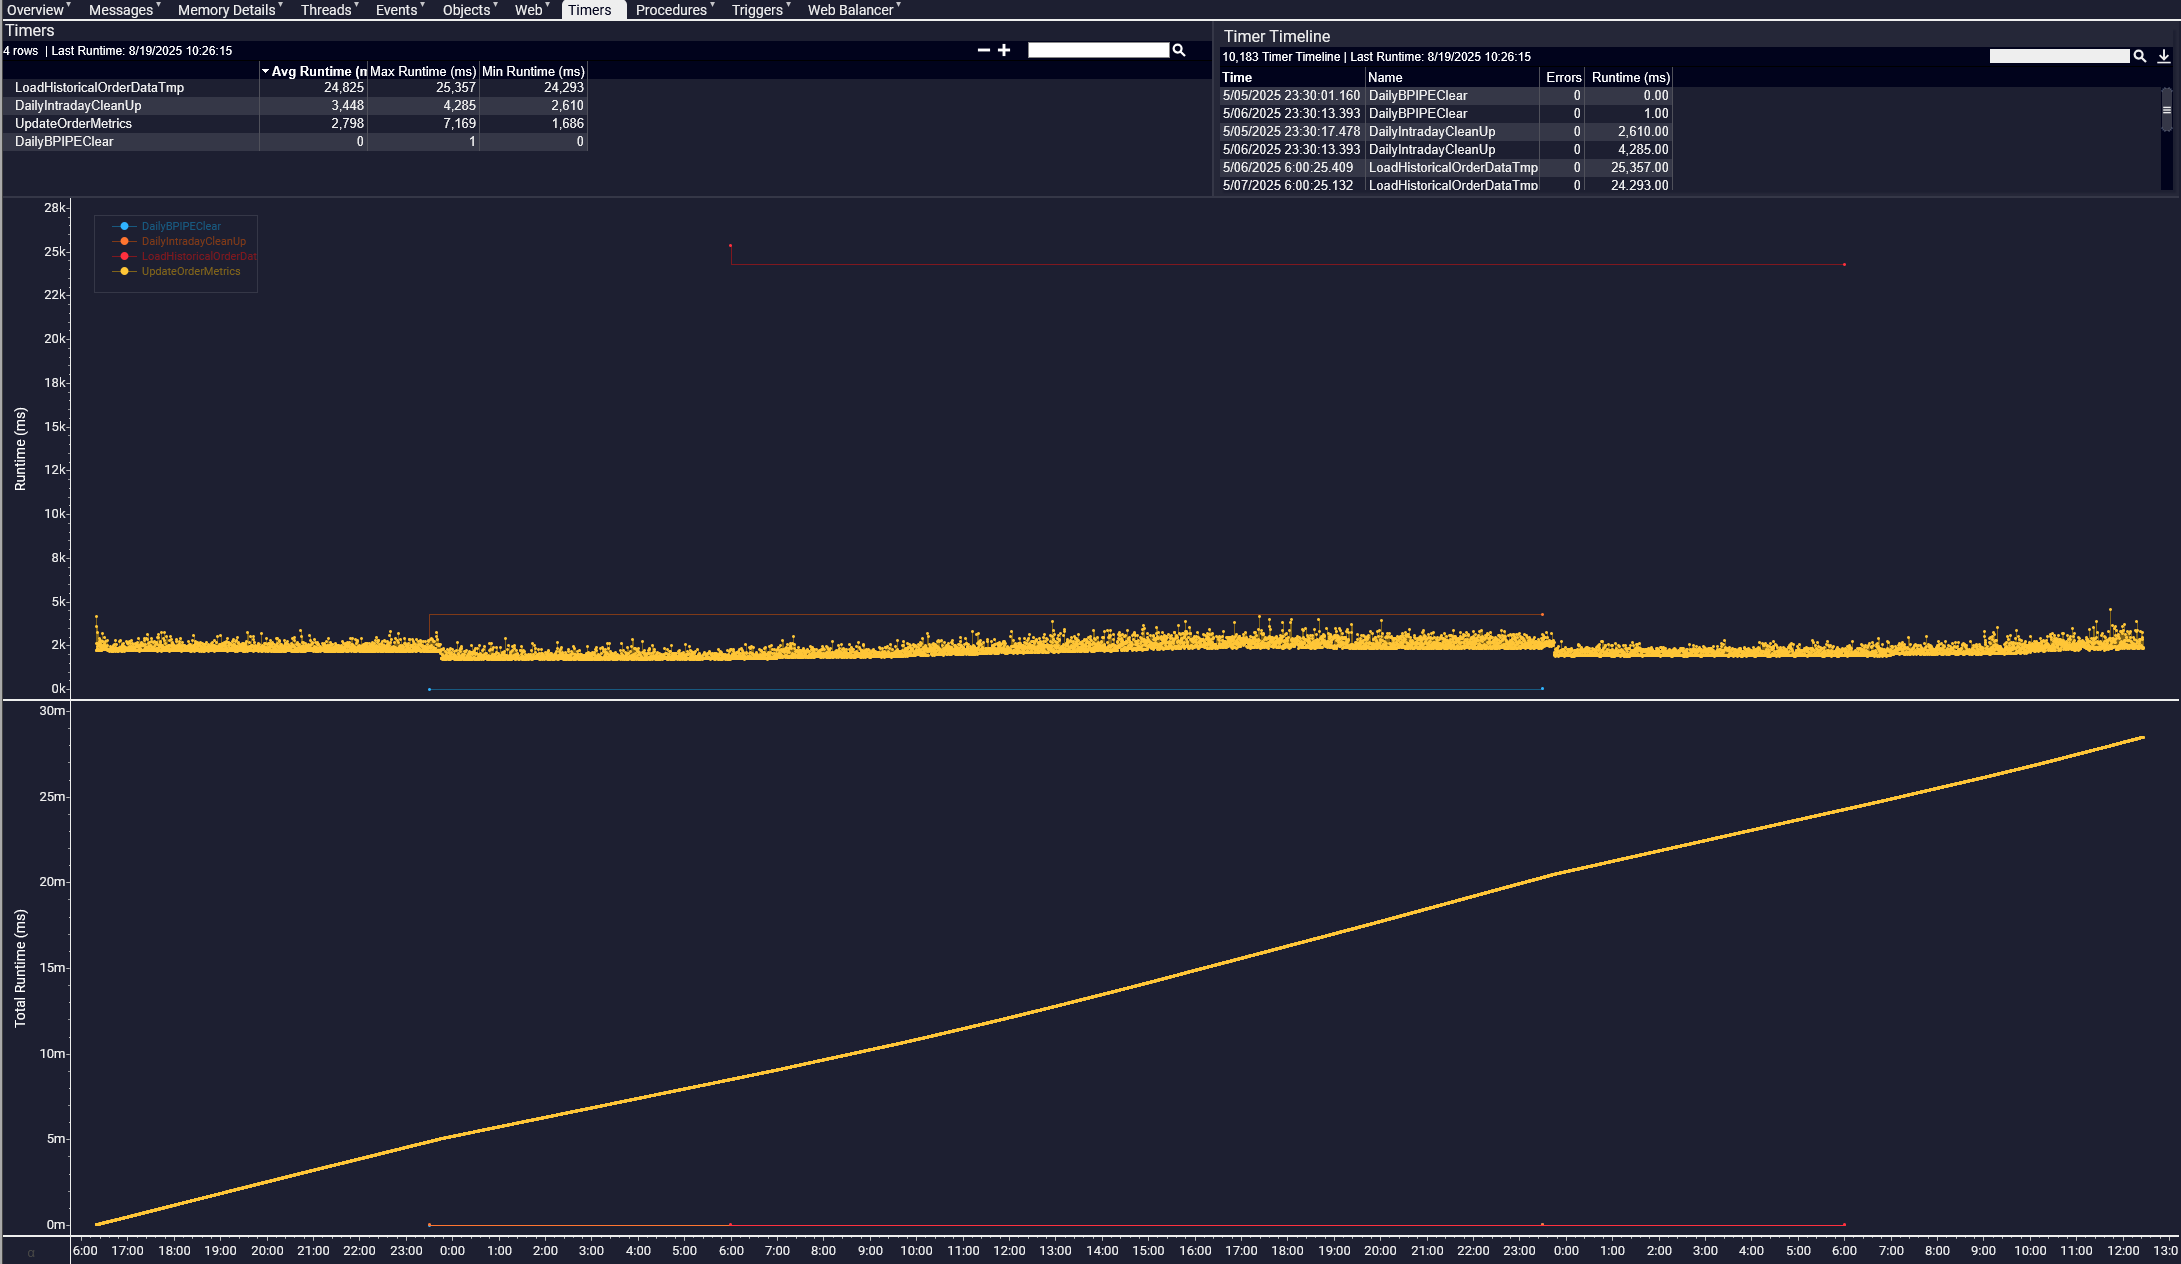
Timers
Timers are scripts/actions that are set to execute at a specific interval of time (i.e., every 5 seconds). This tab contains 2 graphs: Time per Action, and Runtime.
The Runtime graph is the total amount of time a timer has run for. A timer which has been running since 10:00 will have run for 3 minutes at 10:03, regardless of the interval it is set to.
Time per Action measures the length of time it takes for each timer to complete its action once is is activated.
Procedures
Procedures are custom pieces of AmiScript for consistently manipulating tables. For information about procedures in general, look to this page.
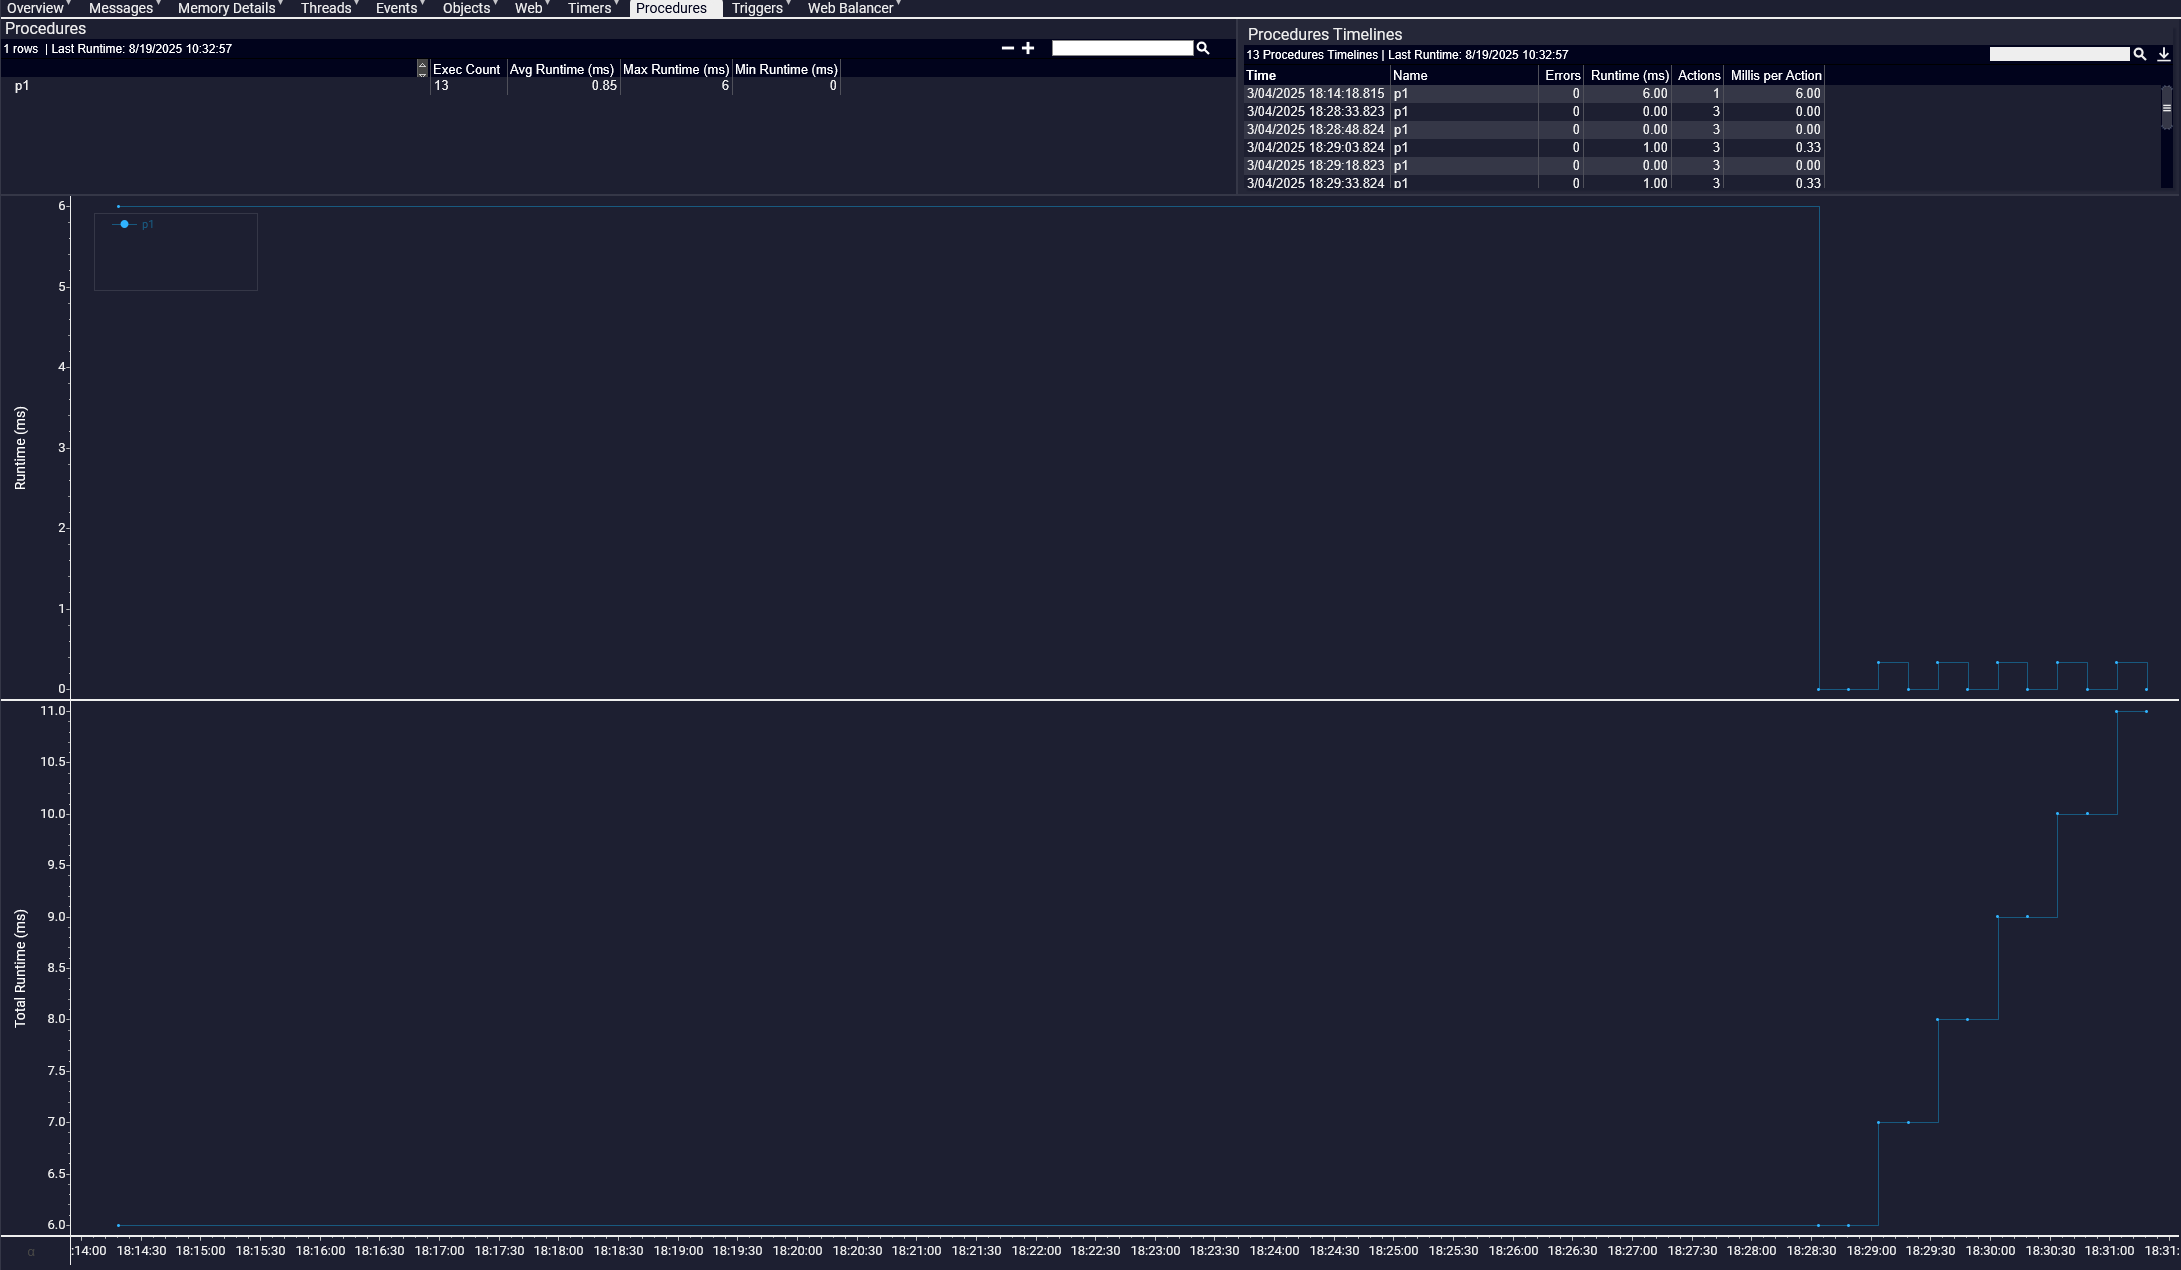
This tab measures the exact same metrics as the previous Timers tab.
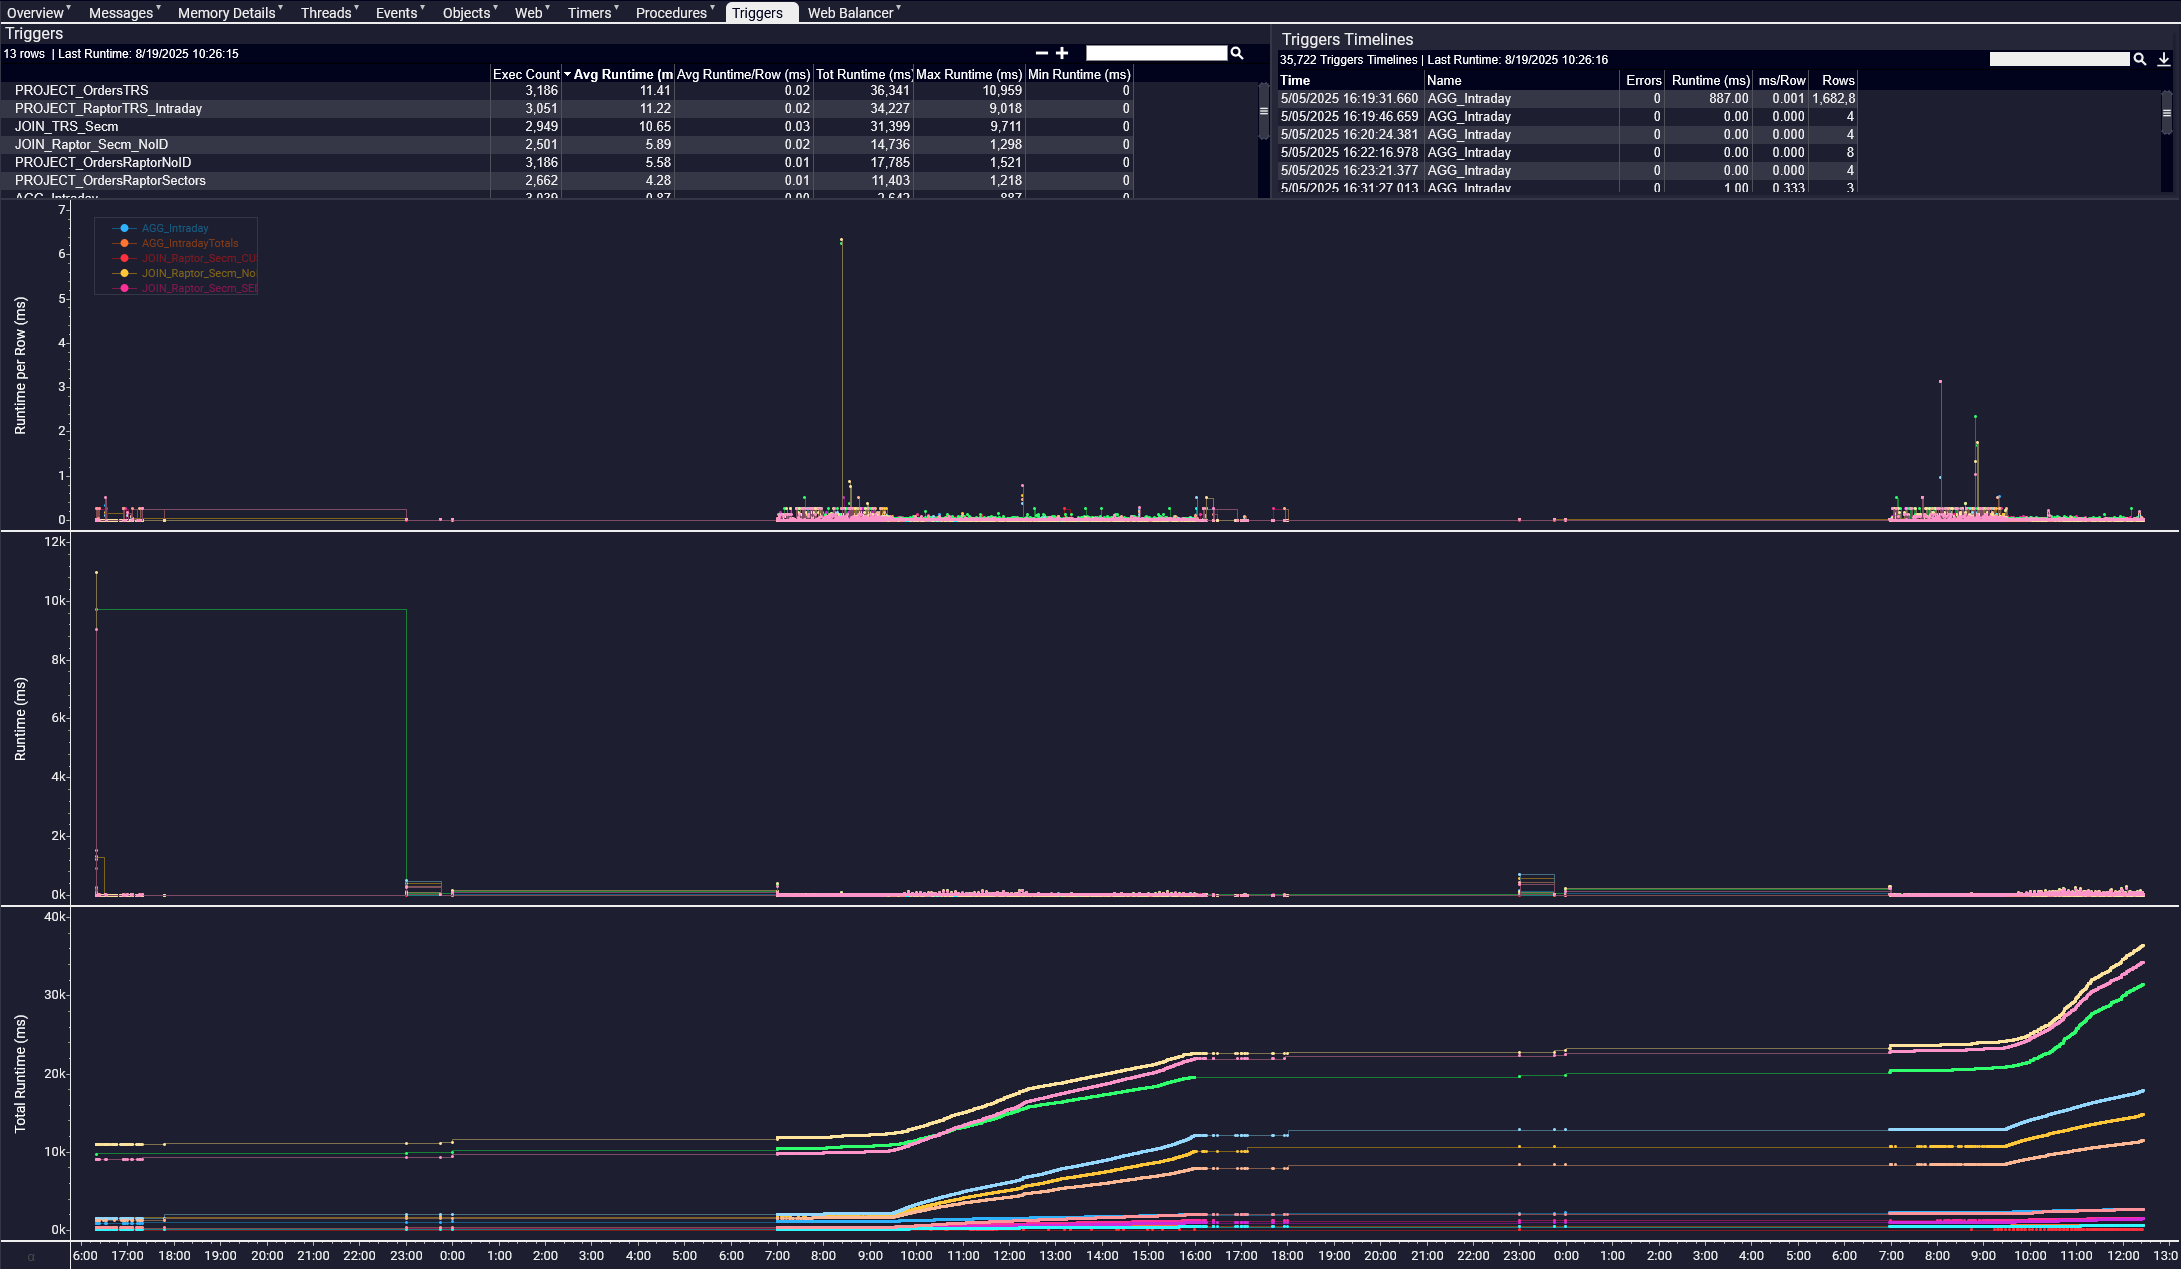
Triggers
Triggers are actions which are automatically taken when a user-specified event occurs. While similar to the Timers tab and the Procedures tab, the Triggers tab has a new graph measuring average runtime, which measures the time it takes for triggers to execute.
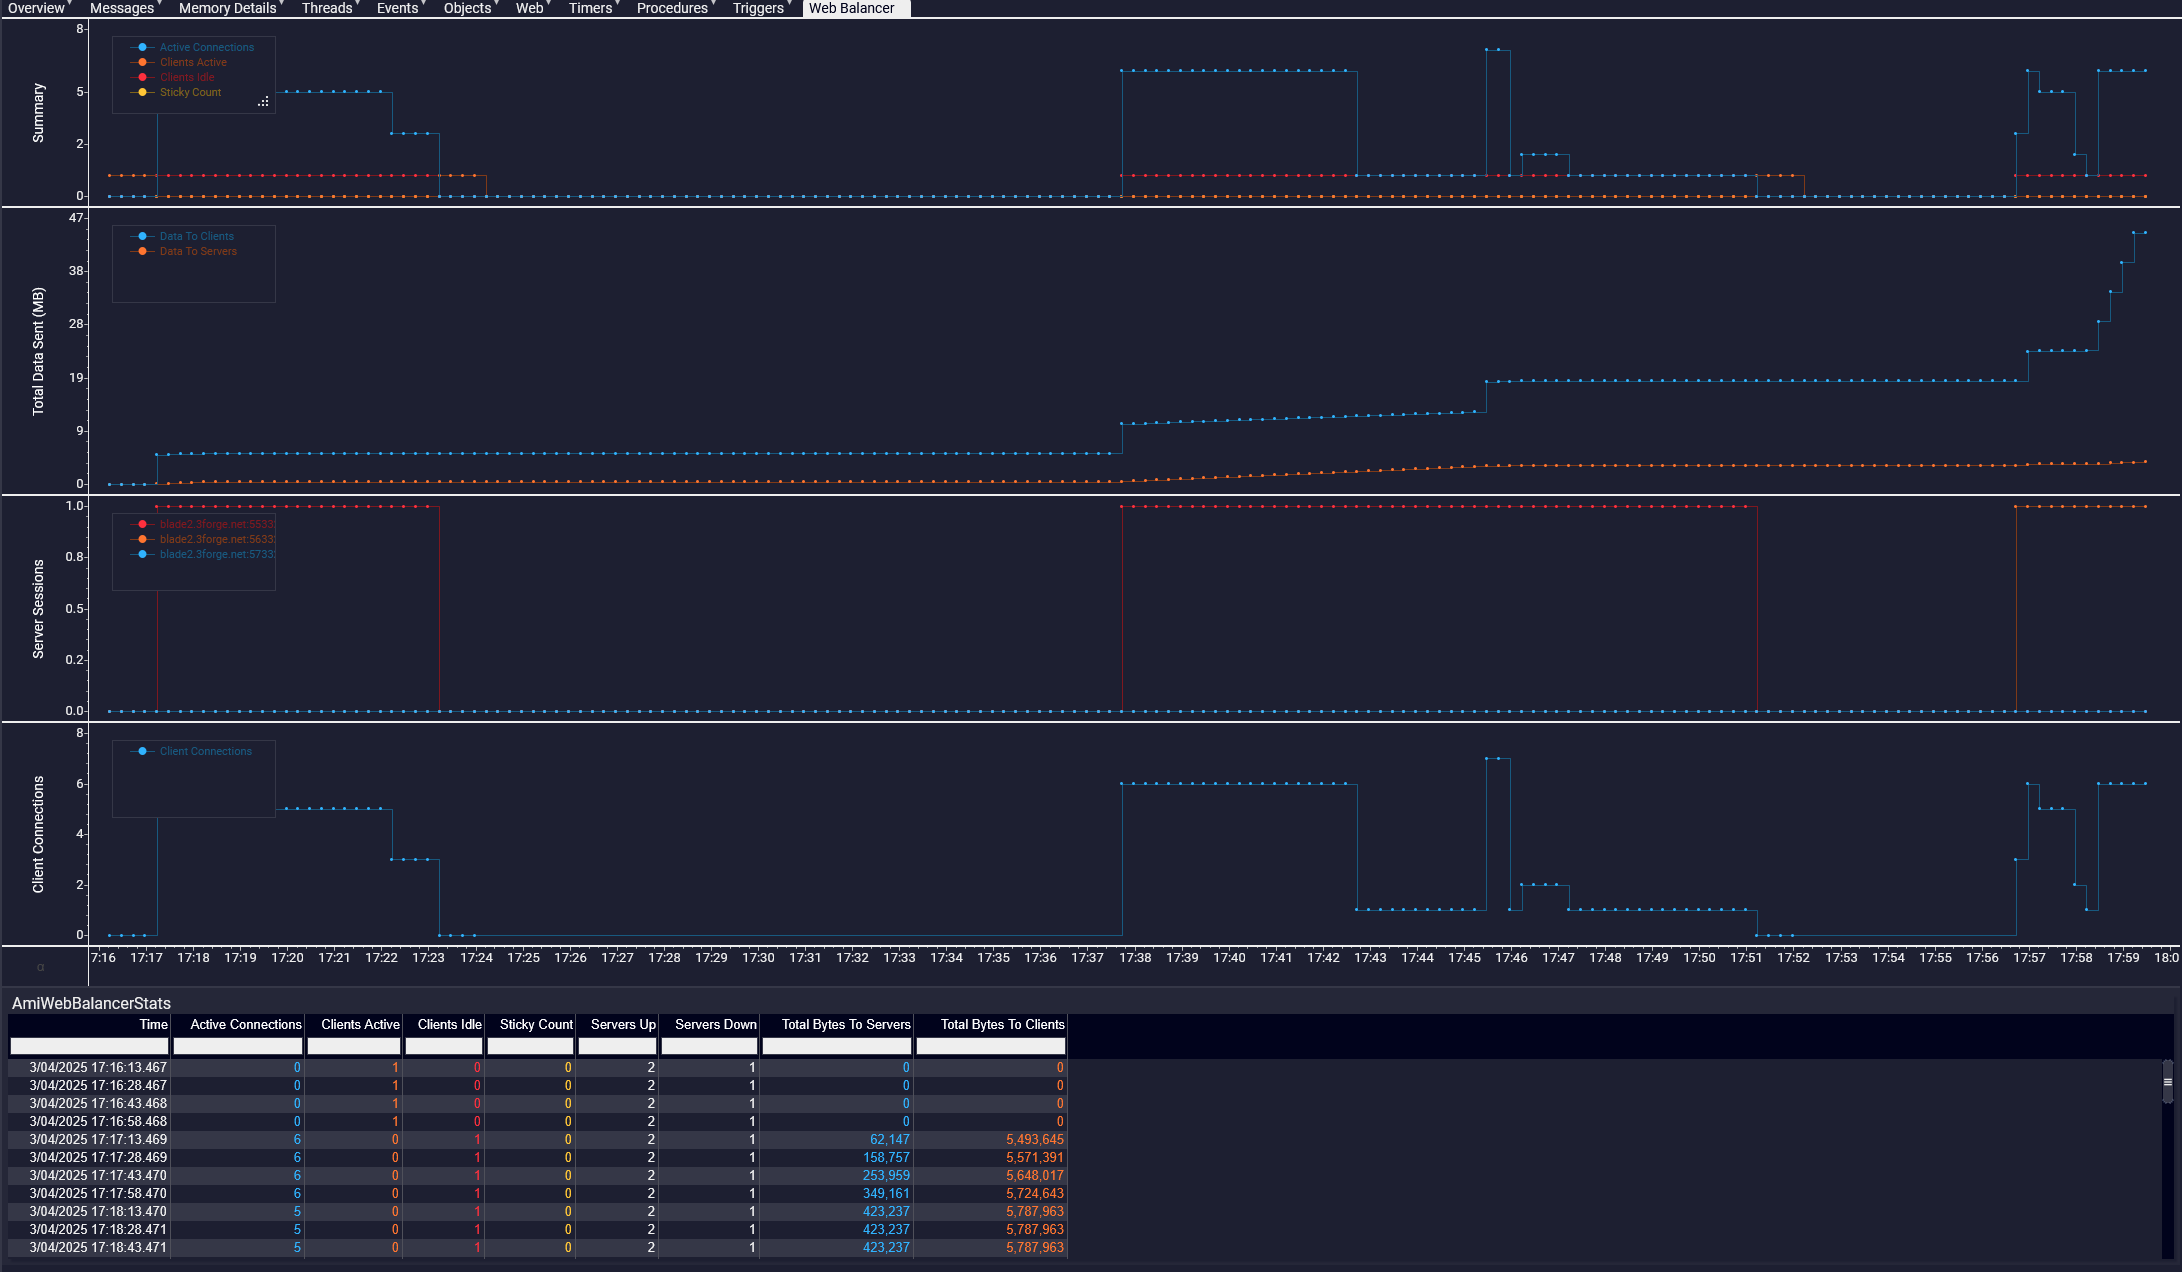
WebBalancer
The WebBalancer is a 3forge component designed to store and send requested layouts and preferences. For more information, look to the WebBalancer/WebManager page.
In addition to its summary graph at the very top, this tab also measures Total Data Sent, Server Sessions, and Client Connections:
-
Total Data Sent: this is the data sent from the WebBalancer to clients and the data sent to web servers. This is measured in megabytes.
-
Server Sessions: this is the total number of active web servers at any given time.
-
Client Connections: the total number of connections to clients the WebBalancer is handling at once.
Comparing Log Files
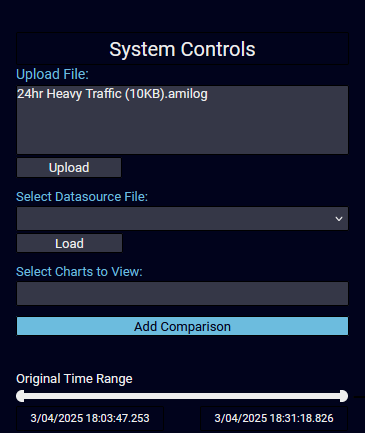
The 3forge log viewer allows users to upload two log files and visualize them side by side. To do this, navigate to the system controls tab on the left of the dashboard, and click the blue "Add Comparison" button.
Then, click on the dialog box beneath "Upload File", select your file, and click "Upload to Compare". The tab should now look something like this:
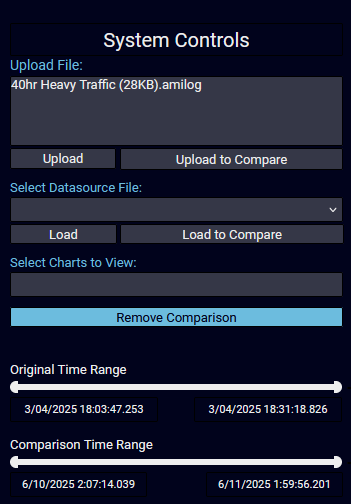
You will then be able to see both log file visualizations.
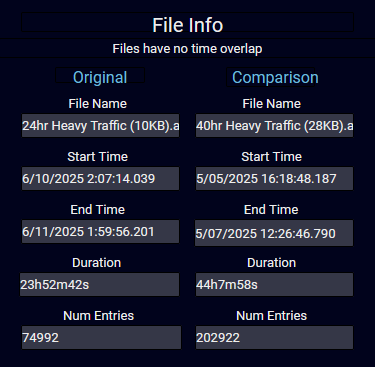
You will also be able to see and compare file information in the bottom left corner.
Interpreting amilog Files
For quick diagnostics, it is still helpful to read through the AmiOne.amilog files. For further detail, it is generally better to read through the AmiOne.log files.
Below is a guide on how to interpret the different message types in the AMI log files without necessarily using the log viewer.
Overview
Information about the state of an AMI instance is recorded in the AMI AmiOne.log files. Broadly, logs can be defined as either Web logs or Center/Relay logs. AMI instances that use all three components will contain all three log types.
These are the primary log types in the AmiOne.log files:
- Memory
- Partition
- Topic
- AmiCenterEvents
See the relevant sections below for a guide on interpreting the log type and the information conveyed.
Memory
Memory messages can be broken down into primarily two types of message: Memory and Process.
Below is an excerpt of what these messages might look like.
This block shows a series of individual memory messages and their respective garbage collectors (the messages with T="Memory").
Following a series of memory messages, AMI will also log a process message which provides a snapshot of the overall memory state at that current point in time.
For understanding memory usage of the system, you will generally only need to interpret the process messages:
now: The time the message was logged (in UTC format).freeMem: The amount of free/available memory in the system.maxMem: The maximum memory AMI can use (set by the user in their Java Options).totMem: The total memory available to use (assigned by JVM).
You can then calculate the used memory from the process messages:
- Used memory =
totMem-freeMem
The memory graph in the log viewer is built on the process messages and can be used to view the total memory usage and consumption by AMI.
Partition
In AMI, tasks are broken down into a series of "partitions" where each partition can be accessed by at most one thread at a given time. There are two message types: Partition and Dispatcher.
In the logs, partition messages look like the following:
A partition is created for a series of different processes, for example:
- for each historical table
- for each user session
- for each datasource added
And more. Each partition message gives a snapshot of that specific partition. Note the ‘inThreadPool’ message which denotes whether that partition is being worked on in that particular snapshot.
Similarly to memory and process messages, dispatcher messages are logged after the partitions. The dispatcher messages provide an overall snapshot of the total partitions and how many partitions are being processed in that given moment. It is essentially the partition manager.
Topic
Topics are essentially bidirectional subscriptions/feeds from one portion of AMI to the other. For example:
This message is a source-to-target topic such that messages are going “in” the direction of the Web from the Center. Conversely, there is an outward (dir = “out”) message acting as the corresponding recipient.
This is particularly useful in identifying if messages are being received promptly, or if they are being queued up (100 messages out but 1 received means 99 are hovering somewhere in a processing queue).
AMI Center Objects
These are a group of log messages that represent the state of different objects in the Center:
AmiCenterTablesAmiCenterTriggersAmiCenterStoredProcs
There is an additional message type, AmiCenterEvents, which provide an overall insight into all the objects and events in the Center at the time. For more information on AmiCenterEvents, see this section of the document.
Issues in the different Center variables like triggers can cause lags in performance. To interpret each individual message type, see the list below.
AmiCenterTables
Each AmiCenterTables message gives the current state of a named table in AMI Center. These can be system tables, prefaced with two underbars (__), or user-created tables.
Here is an example of what this looks like:
The information contained in these messages are:
type: The name of the table (corresponds to AmiCenterObjects in the log viewer).count: The number of rows.
AmiCenterTriggers
User-created triggers that live in the Center and are activated when executed. In the log files, they might look something like this:
Where:
name: Trigger name assigned by use.count: How many times the trigger has run (cumulatively) by that point.millis: How long the trigger took in ms.errors: Number of errors thrown during the trigger. Typically occurs on AmiScript triggers due to a user error.
AmiCenterStoredProcs
Procedures stored in AMI, both created by the user and those from the Center. Center procedures are listed first and prefaced by double underbars (__AMI_PROCEDURE).
Message format and meaning are as follows:
name: Name of the procedure.count: Number of times the procedure has run.millis: Amount of time in ms that the procedure took to run.errors: Number of errors thrown during a procedure.
AmiCenterEvents
AmiCenterEvents messages are logged after the various Center objects have been recorded and provide an overall snapshot of the general state of the Center and the events that have occurred by that point.
AmiCenterEvents messages follow this format:
Both information on Relay and Center events are contained in these messages. Visually, this is represented in the "Events" graph in the log viewer.
These messages are also intrinsically linked to "Topics" messages, since the topic will give an indication of the direction of messages being received and processed.
There are two "events" terms in the messages: events and relayEvents:
-
relayEvents-
Relay events can be thought of as packets or bundles of incoming events from a Relay, such as:
- 5 incoming messages coming at a given time will be packed as 1 Relay event
- This individual Relay event then gets routed where it needs to go, e.g: Center
-
-
events- Total number of events being processed in the Center
A big difference between Relay events and events likely indicates a lot of incoming data (a lot of data being packaged before arriving at the Center).
Web Server Logs
The overall status of the Web component in AMI is stored in a AmiWebHttpServer message in the logs. This will only be logged if "web" is in the list of included components in local.properties.
An example of an AmiWebHttpServer message:
This message contains information on the connection state of users to a Web session at a given time. It also provides information on the rows (tables) that are visible and accessible by users.
Rows
The information of the rows themselves determines which rows are visible:
userRows: Total number of rows visible across all users.userHiddenRows: Rows hidden by a data filter (where theHIDEoption is enabled).userHiddenAlwaysRows: Rows permanently hidden by a data filter.cachedRows: How many rows are cached on Web server end (visualization) relative to the data sources.
Cached rows are a realtime feature only.
Essentially, when any user starts a realtime visualization, that datasource gets cached such that a snapshot of that instance lives on the Web for fast loading. This will be shared across all sessions for one dashboard.
It is up to individual user discretion to determine how much data should be loaded onto the front-end, but AMI automatically caches tables when Web servers spin up. This can be configured in local.properties.