Trees
Trees
Static trees provide a tree view of the data from a datamodel. The data is grouped and aggregated by one or more fields.
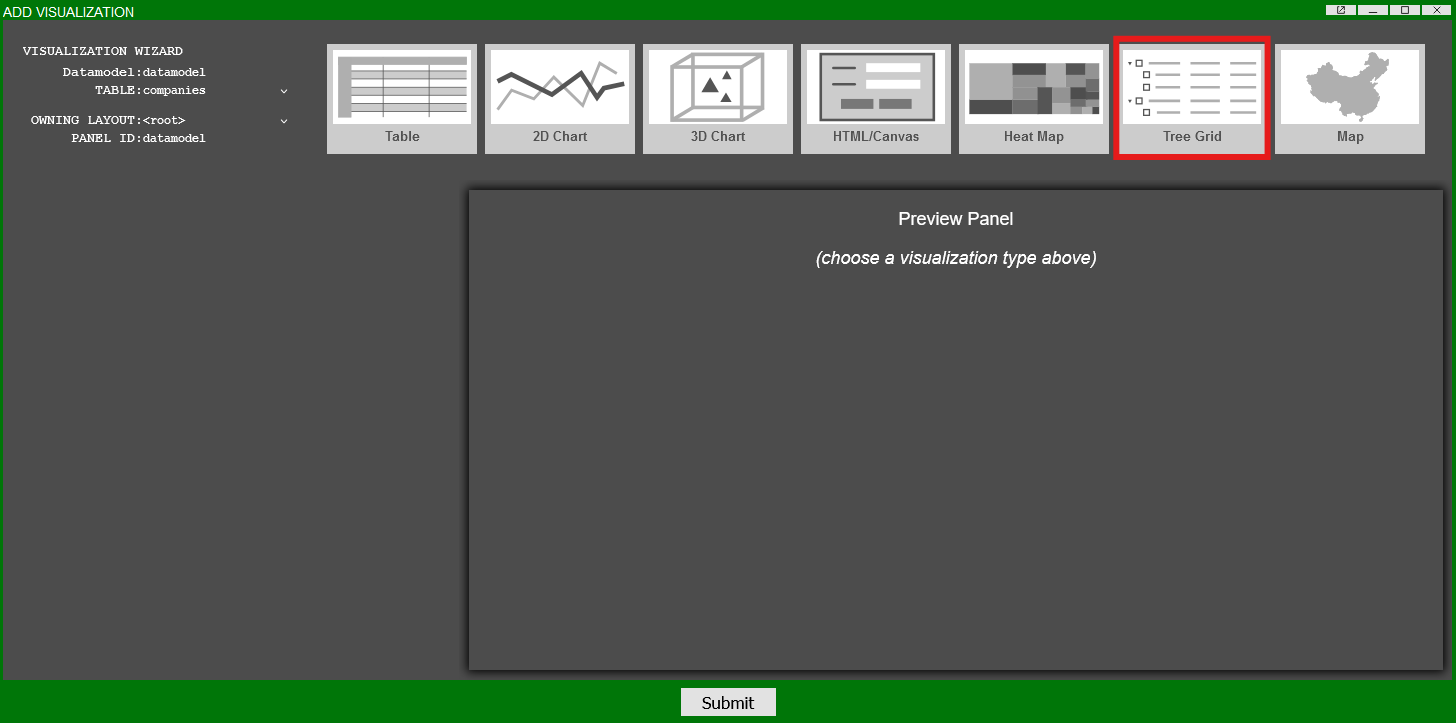
To create a tree based on a datamodel, select Tree Grid in the static visualization selection window of the Visualization Wizard.


In the Create Tree Grid window, select the columns to Group By and the columns to Aggregate By. Each column in the Group By section will be used for a level in the tree, with the very top column being used for the highest level, etc.. Click on Create Tree Grid to finalize the tree creation in the visualization wizard.
To modify any of the groups, use the Grouping tab on the left. In the following example, Grouping 1 will be the highest level of grouping with Grouping 3 the lowest level of grouping:

To add any other level of grouping, click on the \<Add Grouping Formula> button. In the Grouping Options window, the position of the grouping can also be modified (also applies to the groupings that have already been created):

To preview any changes, click on the Refresh button whenever any changes are made in the visualization wizard. Click Finish to create the tree:

The default aggregation is sum; to modify the aggregation, click on the column of the variable to be used and make the necessary changes in the Display field of the Edit Tree Column window:

Leafs
The default setting on tree tables is to not show the leafs:

To view the leafs, select Groupings from the tree's configuration menu (green button). In the Tree Grid Settings, click on Show Leafs and then click on the Leaf Formatting button that shows up:


In the Leaf Options window, use the Display field to select the variable to be used as the leaf. In this example, it will be Name. After making the necessary changes, click Submit on the Tree Grid Settings window to implement the changes:


Compared to the tree table before, you are now able to see the members of the Government Form level.
Recursive Groupings
Trees can have nested entries to show recursive relationships. In the example above, these are the expandable nodes in each continent.
Basic Example
The below AmiScript is for a simple datamodel showing recursive relationships between rows.
-
CREATE TABLE companies(parentCompany String, company String, id long);creates the underlying table structure of this datamodel which has three columns -
INSERT INTO companies Values (null, "Microsoft", 4);inserts a row with no parent (null is a valid entry) -
INSERT INTO companies Values ("Microsoft", "LinkedIn", 5);inserts a row where the entry has the parent "Microsoft" -
INSERT INTO companies Values ("LinkedIn", "LinkedIn EMEA", 6);inserts a row where the entry has the parent "LinkedIn" and by extension the ancestor "Microsoft"
Recursive Tree
This can be represented in a tree structure. Right-click the datamodel and click "Add Table / Visualization / Form" and select "Tree Grid":
From here, define the groupings to show how companies are related to their parent companies:
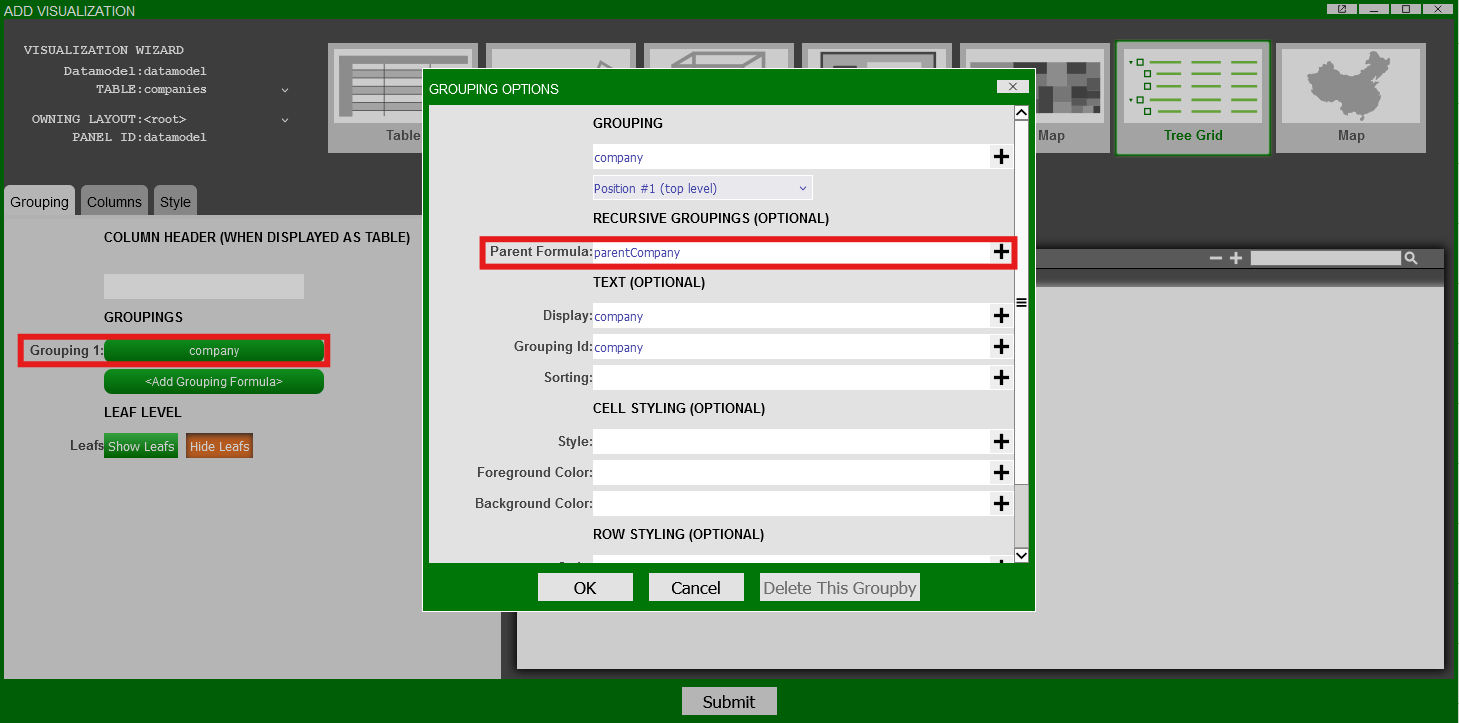
Tip
Refresh the output after each change in the creation wizard to see how the visualization will look like before submitting.
This results in the following tree:
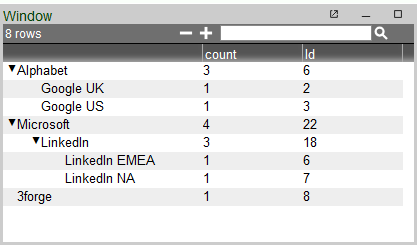
Leaf nodes are recursively linked to their ancestors such that children will be grouped under their parents (see the "LinkedIn EMEA -> LinkedIn -> Microsoft relationship).
The Ids generated by 3forge are sums of the input Ids, but groupings and column formluae can be changed after creation at any point.