Donut Chart of Share by Symbol
Known issues
Some chart features have known issues in the current release. See Known issues.
This walkthrough draws a ring of slices, one per symbol, answering "What share did each symbol take?"
Prerequisites
- Editor mode: click once on the screen, then press Ctrl+d. The AMIDB Shell Tool and the gallery are used as in the quickstart.
- Data: the example data that stage 1 creates. To use a table of your own instead, see With your own data.
1. Create the example data
The chart reads a table in the Center, so create the table first.
- Select Dashboard -> AMIDB Shell Tool....
-
Run:
-
Check that the lower pane shows the 5 rows.
2. Create the chart
The gallery creates a datamodel that reads the table, then places the chart.
- Select Windows -> New Window, then the edit button on
Blank1, then "Create Table / Visualization / Form". - Select "AMI (__AMI)", then "Next >>".
- Select the "USER" tile
ChartDemoTotals, then "Next >>". - Select "Test (alt+enter)", then "Next >>".
- Select the "Radial" tab, then the "Donut" tile.
-
Set the fields below the tiles:
Field Value "Slice size:" Qty"Slice label:" Symbol -
Select "Finish".
- Check that the window shows a ring of 5 slices, labeled with their symbols. The slices are all the same size until stage 3.
3. Size the slices by value
The tile puts "Slice size:" inside sum(...), which draws every slice the same size when each row is one slice.
- Open Plot -> Edit Layers and select the "Donut" layer.
- Under "ANGLE STACK", change "Stack On:" from
sum(Qty)toQty. - Select "OK".
- Check that the slices now differ in size, JPM the largest and NVDA the smallest, and that each label shows its percentage.
Result
A ring of 5 slices in proportion to Qty, JPM the largest and NVDA the smallest, each labeled with its symbol and percentage.
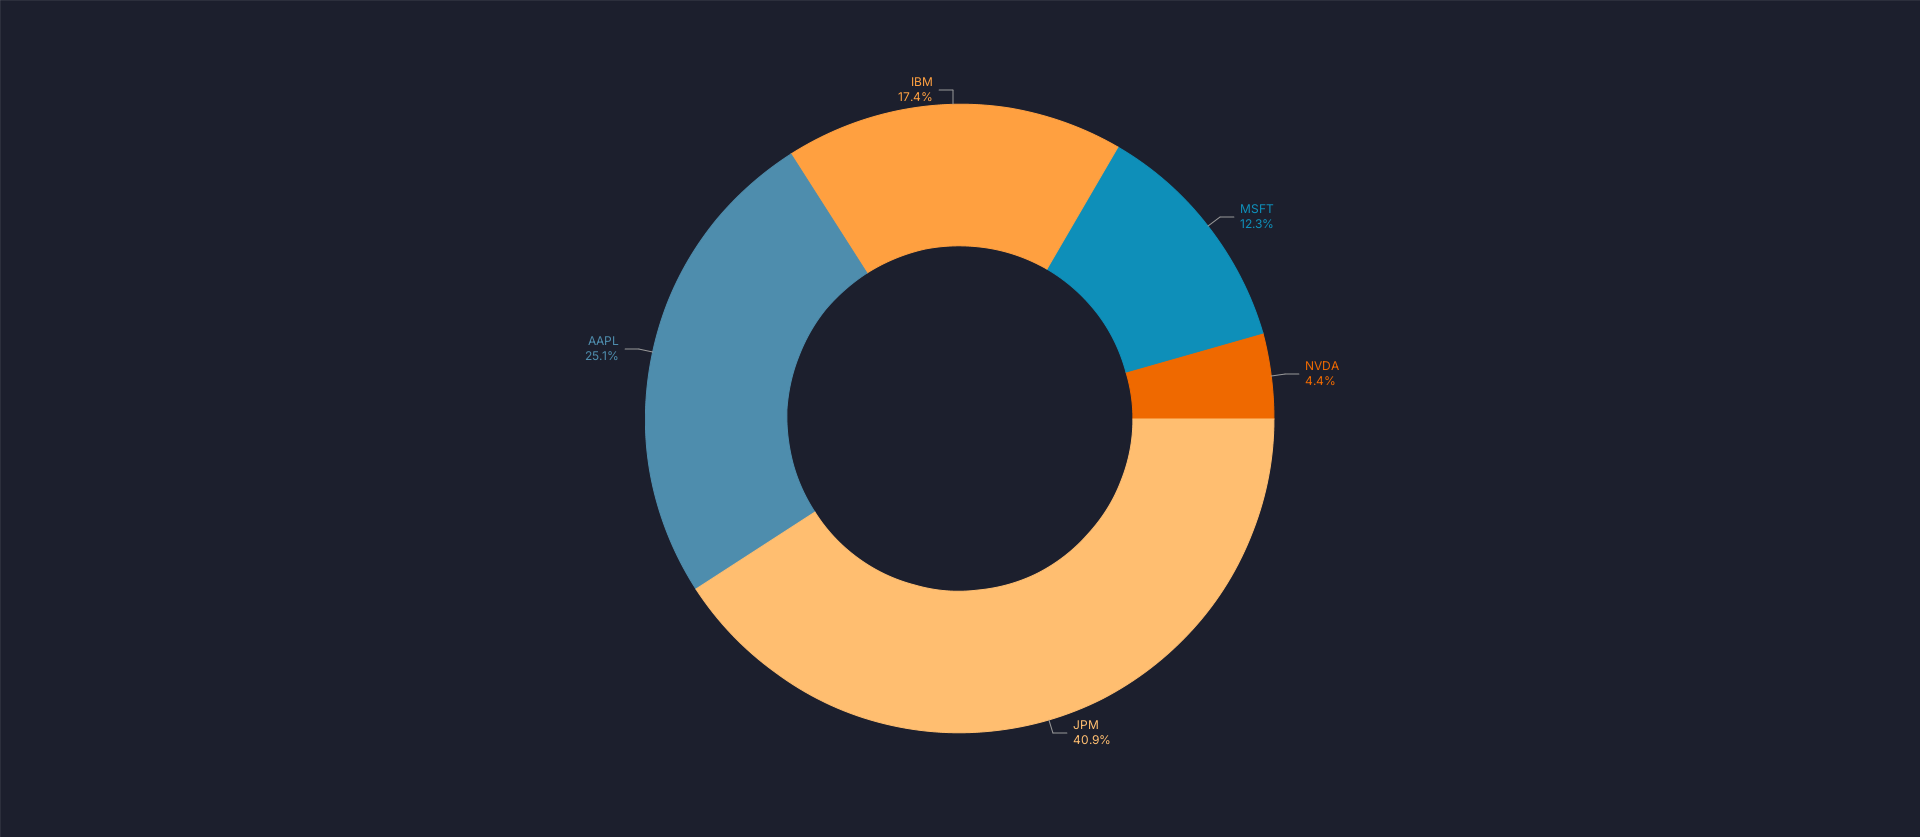
The chart's own PNG export, from AmiScript toImagePng; see Chart type walkthroughs.
To check without looking, read the render stats: session.getDevTools().getAllRenderStats() in the AMIDB Shell Tool, with "Run on this web session" selected (see Running a script), or web_debug op=panelRenderStats over MCP. The "Donut" layer reports Rows 5 and an empty Problem.
With your own data
The chart needs one row per slice: a text column for "Slice label:" and a number for "Slice size:". Stage 3 still applies. In stage 2, select the "USER" tile of your table in place of ChartDemoTotals, and map your columns to the fields in stage 2's field table. Stage 2's check quotes the example data; on yours, check the same features against your own values. To filter rows, or to total raw rows first, see Using your own data.
Over MCP
An agent builds the same chart from the same table. Connecting an agent is covered in the AI section; the tools are on Building charts over MCP.
-
Create the datamodel with
web_executeop=importDatamodeland thisdmJson, then run it once withop=initDatamodelSchemaanddmNameChartDemoTotals: -
Create the chart:
-
Run the datamodel again with
web_executeop=executeDatamodel,dmNameChartDemoTotals. A chart created over MCP can stay empty until its datamodel runs again, with its axes at 0-100. - Confirm that every layer reports the rows above and an empty
Problem: runweb_debugop=panelRenderStats.
The call is web_create_chart_from_template. Over MCP the template draws a full pie of equal slices: as well as wrapping the value in sum(...), it leaves "Auto Min Value:" on, which hides the inner radius. To make it a ring in proportion, export the chart with web_console op=exportPanel, set the layer's "hStackOn" to "Qty" and "autoMinValue" to false, pass the result to web_execute op=updatePanel, and run the datamodel again with op=executeDatamodel.
Removing the example
Remove the chart, then its datamodel, then the table, so that the next walkthrough can reuse the names:
- Close the chart's window with its close button, and select "Delete" when asked whether to delete the panel.
- Select Dashboard -> Data Modeler..., expand "Datamodels", right-click the chart's datamodel,
ChartDemoTotals, and select "Delete Datamodel", then "Yes". If that name was taken when stage 2 ran, the gallery added a number to it, as inChartDemoTotals1. - Run
DROP TABLE ChartDemoTotals;in the AMIDB Shell Tool. - Check that
SELECT * FROM ChartDemoTotals;reportsUnknown table: ChartDemoTotals.
Over MCP, delete the chart with web_danger op=deletePanel, then the datamodel with op=deleteDatamodel, dmName ChartDemoTotals, and drop the table as in step 3. deleteDatamodel refuses a datamodel that has been committed; delete that one in the Data Modeler as in step 2. See Removing an agent's chart.