Org Chart of a Trading Floor
Known issues
Some chart features have known issues in the current release. See Known issues.
This walkthrough draws an org chart of a head of trading and 3 desks, answering "Who reports to whom?"
Prerequisites
- Editor mode: click once on the screen, then press Ctrl+d. The AMIDB Shell Tool and the gallery are used as in the quickstart.
- Data: the example data that stage 1 creates. To use a table of your own instead, see With your own data.
1. Create the example data
The chart reads a table in the Center, so create the table first.
- Select Dashboard -> AMIDB Shell Tool....
-
Run:
-
Check that the lower pane shows the 7 rows.
The template draws each row as an annotation of the kind its "Row kind:" column names: box draws a box from (X1, Y1) to (X2, Y2) with its label, and segment draws a line between the two points. It computes no layout, so every box and connector is placed by the table. Y runs upward, so a box's top is its larger Y.
2. Create the chart
The gallery creates a datamodel that reads the table, then places the chart.
- Select Windows -> New Window, then the edit button on
Blank1, then "Create Table / Visualization / Form". - Select "AMI (__AMI)", then "Next >>".
- Select the "USER" tile
ChartDemoOrg, then "Next >>". - Select "Test (alt+enter)", then "Next >>".
- Select the "Flow" tab, then the "Tree / Org" tile.
-
Set the fields below the tiles:
Field Value "Row kind:" Kind"X (left / from):" X1"Y (top / from):" Y1"X2 (right / to):" X2"Y2 (bottom / to):" Y2"Label:" Label"Colour by:" Grp -
Select "Finish".
- Check that the window shows a "Head of Trading" box joined by 3 lines to "Equities", "Rates", and "FX" boxes below it.
Result
4 boxes, each in its own color with a white label, and 3 connectors from the head's box to the desks.
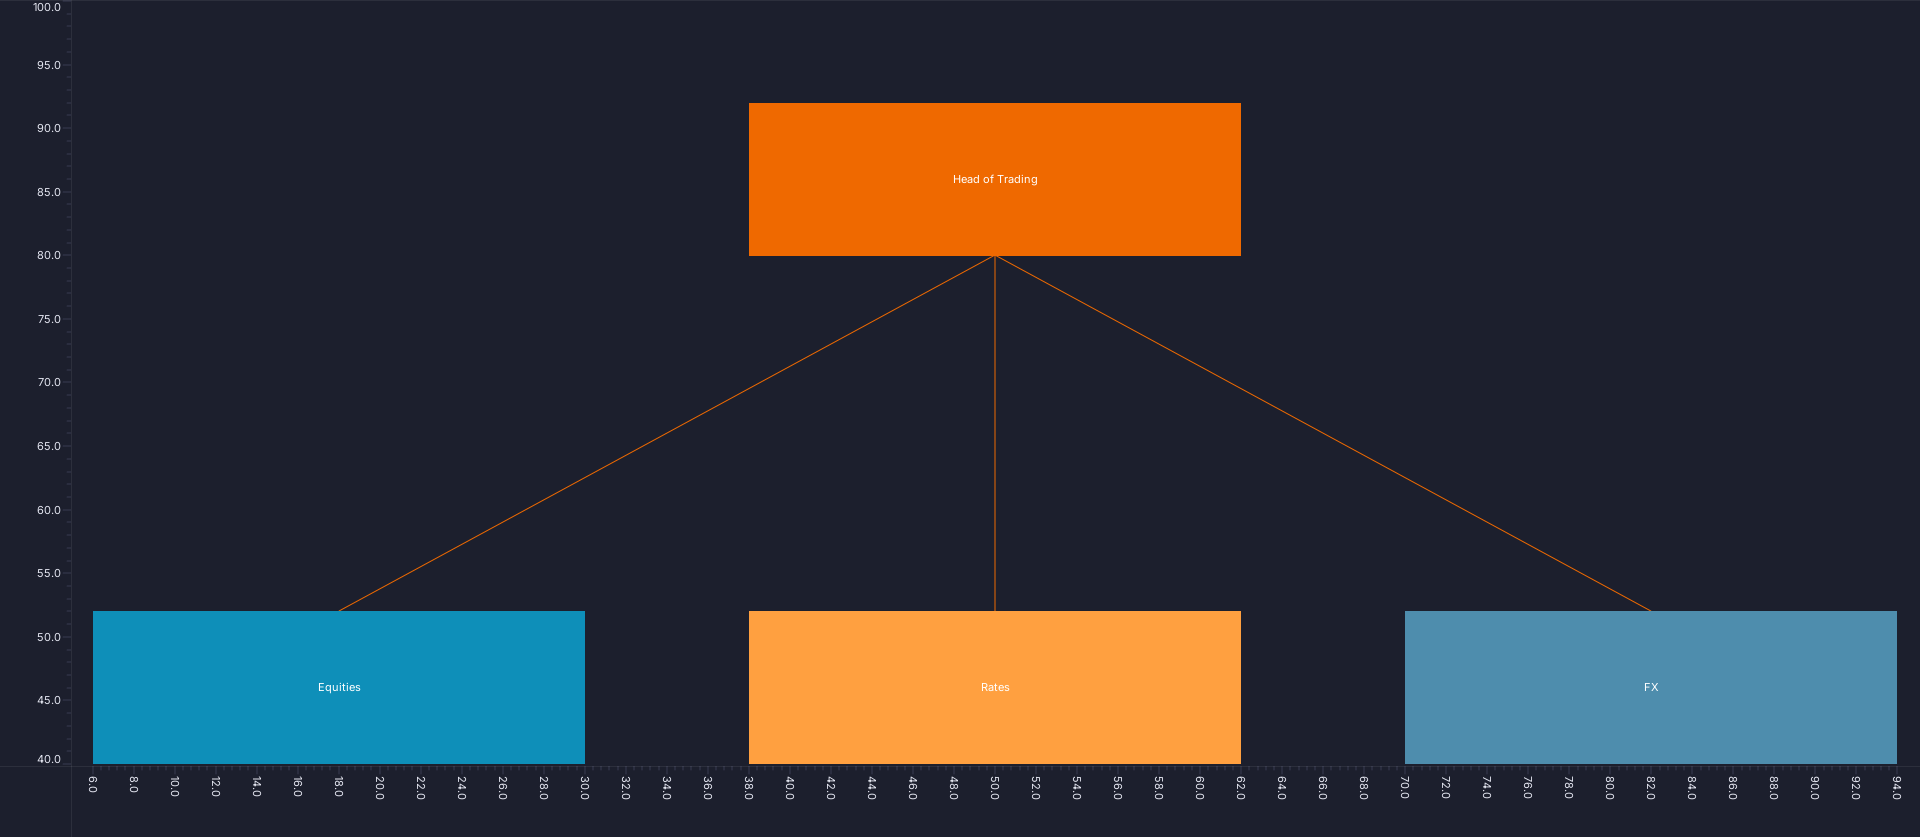
The chart's own PNG export, from AmiScript toImagePng; see Chart type walkthroughs.
To check without looking, read the render stats: session.getDevTools().getAllRenderStats() in the AMIDB Shell Tool, with "Run on this web session" selected (see Running a script), or web_debug op=panelRenderStats over MCP. The "Nodes & Edges" layer reports Rows 7 and an empty Problem.
With your own data
The chart needs every box and connector as a row of its own, with its kind and its corners: "X (left / from):", "Y (top / from):", "X2 (right / to):", and "Y2 (bottom / to):". The template computes no positions, so the datamodel must supply every one: these charts suit data that already carries its positions, or a query written for one fixed layout. To filter rows, or to total raw rows first, see Using your own data.
Over MCP
An agent builds the same chart from the same table. Connecting an agent is covered in the AI section; the tools are on Building charts over MCP.
-
Create the datamodel with
web_executeop=importDatamodeland thisdmJson, then run it once withop=initDatamodelSchemaanddmNameChartDemoOrg: -
Create the chart:
-
Run the datamodel again with
web_executeop=executeDatamodel,dmNameChartDemoOrg. A chart created over MCP can stay empty until its datamodel runs again, with its axes at 0-100. - Confirm that every layer reports the rows above and an empty
Problem: runweb_debugop=panelRenderStats.
The call is web_create_chart_from_template. With no bindings, it fits the roles to columns with matching names, such as "Row kind" to Kind; read the reply's ROLE MAP, and pass bindings, as above, where it fits one wrongly.
Removing the example
Remove the chart, then its datamodel, then the table, so that the next walkthrough can reuse the names:
- Close the chart's window with its close button, and select "Delete" when asked whether to delete the panel.
- Select Dashboard -> Data Modeler..., expand "Datamodels", right-click the chart's datamodel,
ChartDemoOrg, and select "Delete Datamodel", then "Yes". If that name was taken when stage 2 ran, the gallery added a number to it, as inChartDemoOrg1. - Run
DROP TABLE ChartDemoOrg;in the AMIDB Shell Tool. - Check that
SELECT * FROM ChartDemoOrg;reportsUnknown table: ChartDemoOrg.
Over MCP, delete the chart with web_danger op=deletePanel, then the datamodel with op=deleteDatamodel, dmName ChartDemoOrg, and drop the table as in step 3. deleteDatamodel refuses a datamodel that has been committed; delete that one in the Data Modeler as in step 2. See Removing an agent's chart.