Boxplot of Spreads by Venue
Known issues
Some chart features have known issues in the current release. See Known issues.
This walkthrough draws a box and whiskers per venue from 5 precomputed values, answering "Which venue has the widest spreads?"
Prerequisites
- Editor mode: click once on the screen, then press Ctrl+d. The AMIDB Shell Tool and the gallery are used as in the quickstart.
- Data: the example data that stage 1 creates. To use a table of your own instead, see With your own data.
1. Create the example data
The chart reads a table in the Center, so create the table first.
- Select Dashboard -> AMIDB Shell Tool....
-
Run:
-
Check that the lower pane shows the 4 rows.
The template draws the 5 values it is given and computes nothing, so the table already holds each venue's minimum, quartiles, median, and maximum.
2. Create the chart
The gallery creates a datamodel that reads the table, then places the chart.
- Select Windows -> New Window, then the edit button on
Blank1, then "Create Table / Visualization / Form". - Select "AMI (__AMI)", then "Next >>".
- Select the "USER" tile
ChartDemoSpread, then "Next >>". - Select "Test (alt+enter)", then "Next >>".
- Select the "Cartesian" tab, then the "Boxplot" tile.
-
Set the fields below the tiles:
Field Value "Category:" Venue"Min:" MinBp"Q1:" Q1Bp"Median:" MedianBp"Q3:" Q3Bp"Max:" MaxBp -
Select "Finish".
- Check that the window shows 4 boxes, BATS, IEX, NASDAQ, and NYSE, each with a median line and whiskers.
Result
4 boxes. BATS has the highest median, 2.4, and the longest whisker, to 5.2; NASDAQ the lowest, 1.6.
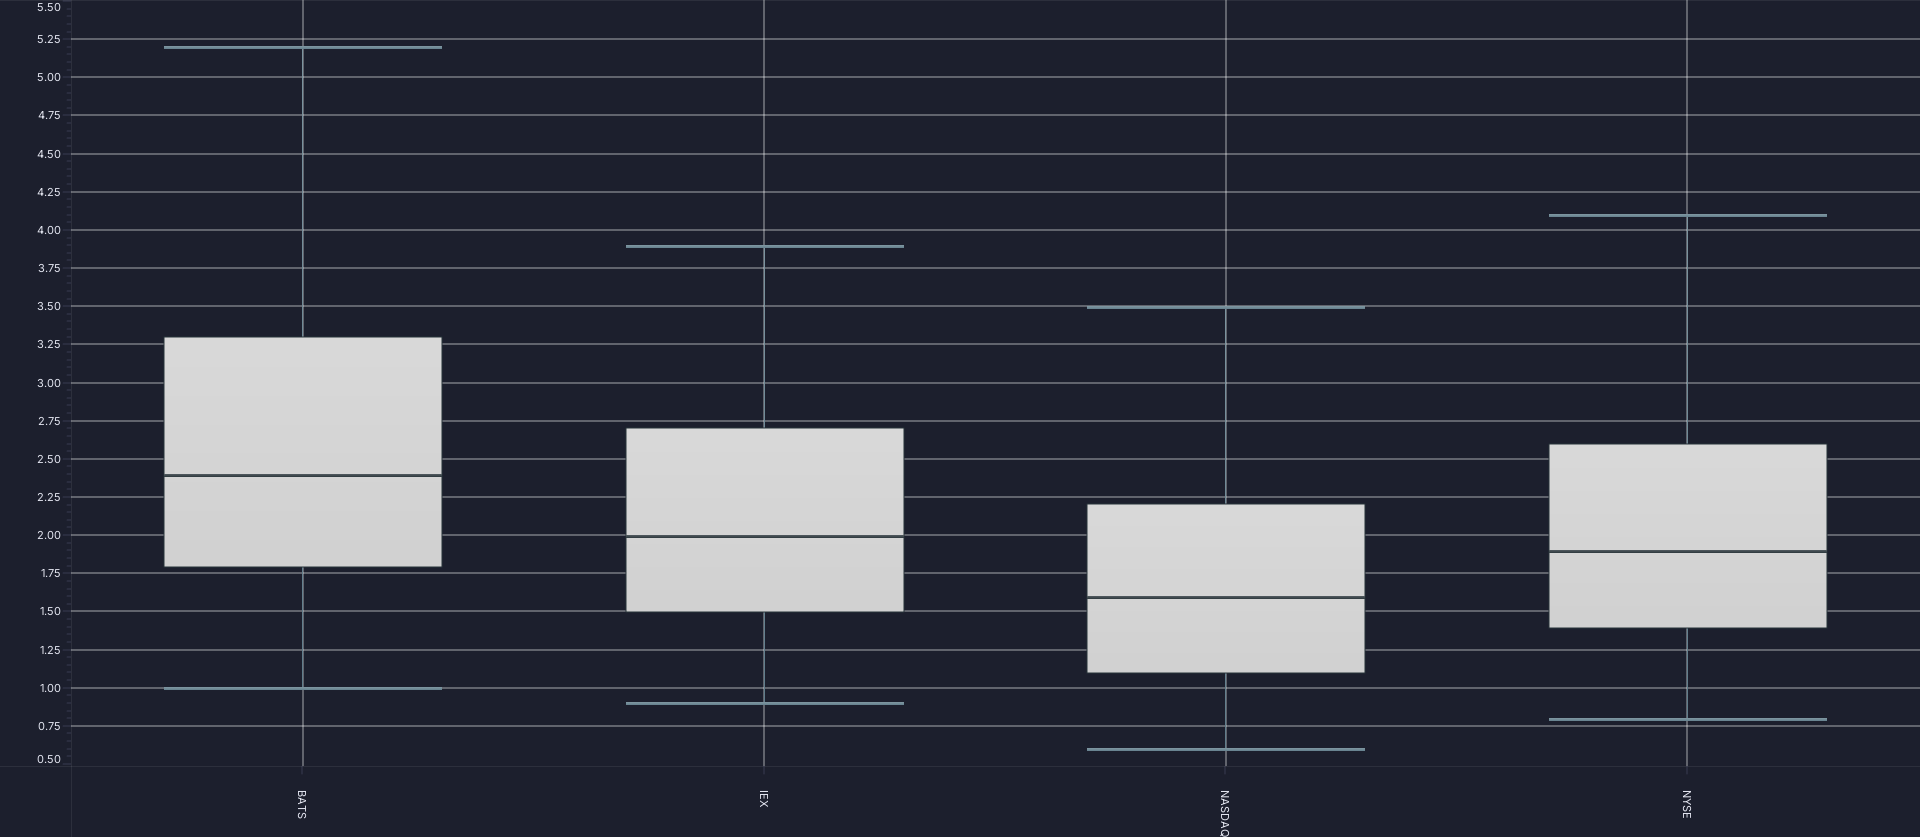
The chart's own PNG export, from AmiScript toImagePng; see Chart type walkthroughs.
To check without looking, read the render stats: session.getDevTools().getAllRenderStats() in the AMIDB Shell Tool, with "Run on this web session" selected (see Running a script), or web_debug op=panelRenderStats over MCP. The "Box", "Median", "Whisker", "Min Cap", and "Max Cap" layers each report Rows 4 and an empty Problem.
With your own data
If your table holds one row per observation rather than the 5 values per category, shape the rows in the datamodel's query. To try it on example rows, run this in the AMIDB Shell Tool first:
Remove it afterwards with DROP TABLE ChartDemoFills;.
- Follow stage 2 with the "USER" tile
ChartDemoFills, or the one for your own table, in place ofChartDemoSpread. -
When the gallery shows the datamodel's query, replace the query with:
-
Select "Test (alt+enter)".
- Check that the "Tables" tab shows
ChartDemoSpreadalone, with the same 4 rows as the example table in stage 1.
Then continue with stage 2: the fields are the same, and any later stages apply as written. To do this over MCP, put the same statements in the onProcess of the datamodel that step 1 of "Over MCP" imports, with USE ds="AMI" before each EXECUTE.
percentileCont interpolates between observations; percentileDisc takes the nearest one instead.
Over MCP
An agent builds the same chart from the same table. Connecting an agent is covered in the AI section; the tools are on Building charts over MCP.
-
Create the datamodel with
web_executeop=importDatamodeland thisdmJson, then run it once withop=initDatamodelSchemaanddmNameChartDemoSpread: -
Create the chart:
-
Run the datamodel again with
web_executeop=executeDatamodel,dmNameChartDemoSpread. A chart created over MCP can stay empty until its datamodel runs again, with its axes at 0-100. - Confirm that every layer reports the rows above and an empty
Problem: runweb_debugop=panelRenderStats.
The call is web_create_chart_from_template.
Removing the example
Remove the chart, then its datamodel, then the table, so that the next walkthrough can reuse the names:
- Close the chart's window with its close button, and select "Delete" when asked whether to delete the panel.
- Select Dashboard -> Data Modeler..., expand "Datamodels", right-click the chart's datamodel,
ChartDemoSpread, and select "Delete Datamodel", then "Yes". If that name was taken when stage 2 ran, the gallery added a number to it, as inChartDemoSpread1. - Run
DROP TABLE ChartDemoSpread;in the AMIDB Shell Tool. - Check that
SELECT * FROM ChartDemoSpread;reportsUnknown table: ChartDemoSpread.
Over MCP, delete the chart with web_danger op=deletePanel, then the datamodel with op=deleteDatamodel, dmName ChartDemoSpread, and drop the table as in step 3. deleteDatamodel refuses a datamodel that has been committed; delete that one in the Data Modeler as in step 2. See Removing an agent's chart.